
Limited Partners versus Unlimited Machines: Artificial Intelligence and the Performance of Private Equity Funds (2023)
Reiner Braun, Borja Fernández Tamayo, Florencio López-de-Silanes, Ludovic Phalippou, Natalia Sigrist
CEFS Research Paper, URL/SSRN
This week’s AGNOSTIC Paper is somewhat outside my major area of competence, but I think it is a good example where we are heading to in the investment industry. Over the last years, it became quite standard that investors use the latest tools of machine learning to analyze non-quantitative information like text or images at a scale that hasn’t been possible before. So far, however, the efforts were mostly focused on public markets. In their not yet published working paper, this week’s authors show that there seems to be also a lot of potential for such methods in private markets.
Everything that follows is only my summary of the original paper. So unless indicated otherwise, all tables and charts belong to the authors of the paper and I am just quoting them. The authors deserve full credit for creating this material, so please always cite the original source.
Setup and Idea
The authors start with a few empirical facts. Over the last decades, private equity (PE) established itself as standard asset class and reached assets under management of about $8T in 2022. Basically all PE-funds are exclusively available to institutional clients and given the lack of passive alternatives, institutions have built considerable teams to select PE-funds and managers. As most forms of active management, selecting successful PE-funds before they already are successful is not easy and requires skill.
Like in public markets, PE-fund selectors process all kind of information to formulate their expectations about the future. In practice, these are for example the reputation of firms, past performance or the résumés of investment managers. Most importantly, PE-managers also distribute lengthy documents about their funds during the fundraising process. While those documents certainly contain a lot of valuable information, the problem for PE-investors (as the name suggests) is that they are private and only distributed confidentially. For public equities, for example, you can easily go to a database and collect annual reports of companies or fund prospectuses to analyze them at scale. This is not so easy for PE-funds and it is therefore much more work to get an overview about the investment universe than it is for public markets.
The simple idea of this week’s paper is to address this challenge. The authors partner with a global institutional investor based in Europe and thereby obtain information about a relatively large sample of PE-funds and their documents. This allows them to 1) analyze those documents with modern natural language processing at scale, and 2) examine whether machine learning models that are capable of processing such text data are helpful for manager selection in private markets. To the best of my and the authors’ knowledge, this is the first research that applies such modern quantitative tools to private market investments.
Data and Methodology
The authors get their data from the archives of “a large global institutional investor based in Europe who is mostly focused on growth capital and leveraged buy-out funds, and more focused on European funds than on US funds.” In total, this yields a sample of 951 Private Placement Memorandums (PPMs) from between 1999 and 2020. PPMs are comprehensive documents which PE-managers send to potential investors during fundraising. According to the authors, those documents contain all kind of information like legal disclaimers, past performance figures or general information about the firm. Most importantly, however, there is also a section about the strategy and investment opportunity of the particular fund which is usually written by the investment team. The authors focus on this section of the PPMs for most of their analyses.
Before continuing, however, they apply various filters. For example, they remove funds without listing in the Preqin database1A standard data-provider for private markets investments. and only keep funds with at least 6 years of performance history as of June 2022.2They exclude funds with vintage years after 2016. As I am also a tourist in this asset class, I had to look up the jargon. Vintage is the year in which funds deploy capital for the first time. This is not necessarily the year of fundraising. Funds that completed fundraising but haven’t made an investment so far are those with what the press usually calls dry powder. They also exclude funds that are focused on venture capital and real assets, and require the PPMs to contain a strategy section. After all filters, the final sample consists of 395 PE-funds and the following table provides a few summary statistics.
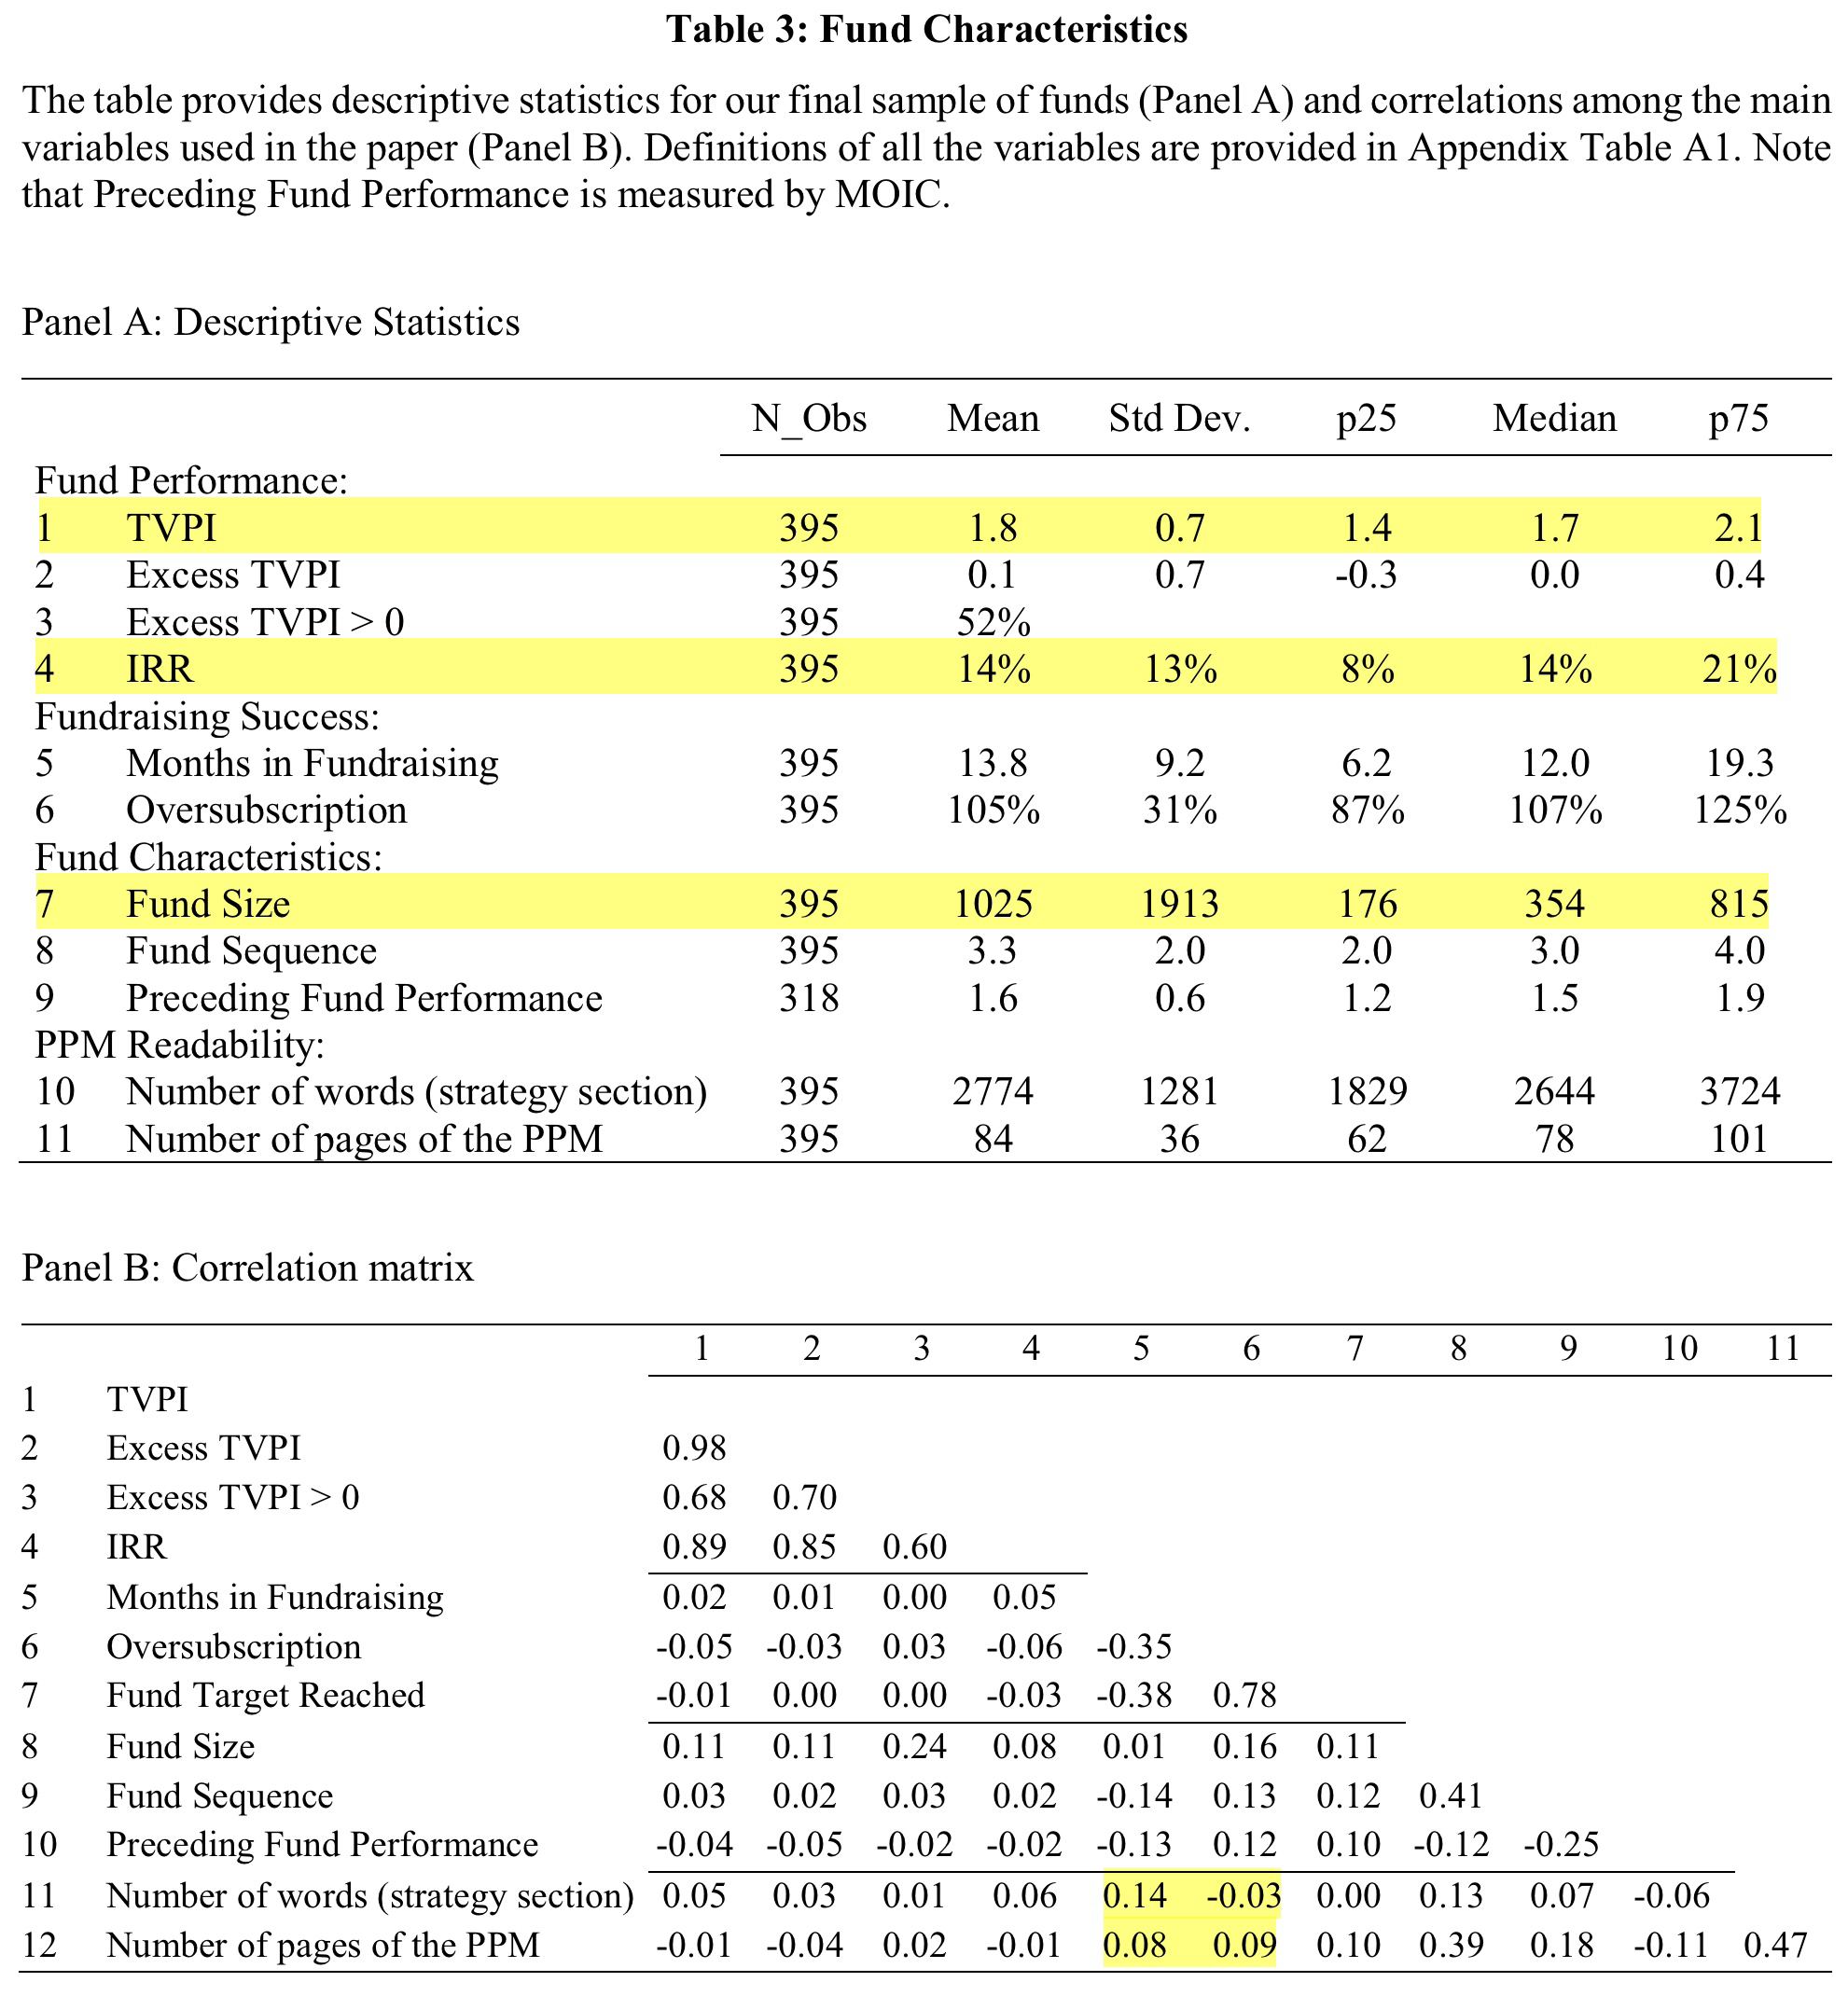
TVPI stands for Total Value on Paid-In Capital and is basically the wealth-multiple that investors realize from their investment in a fund. Excess TVPI, for this paper, is the difference between the median TVPI of funds from the Preqin database with a similar strategy and the same fundraising year. IRR is the Internal Rate of Return, something like the hypothetical annualized return of a fund over its lifetime. Both are standard measures to evaluate the performance of PE-funds and the authors use them as criteria for most of their analyses.
I highlighted a few numbers that I find particularly interesting. First, the returns of the PE-funds in the sample are pretty good. The average fund delivered a 1.8 TVPI and an IRR of 14%. Second, there is considerable dispersion among managers. For example, the range between the 25%- and 75%-quantile spans between 8% and 21% for the IRR. Needless to say, a performance difference of 13%-points compounded over multiple years is very substantial. Third, the size distribution of the funds is massively skewed. The average fund is slightly larger than a billion EUR (1025m) while the median fund manages “just” 354m EUR.
Of course, it is a natural concern that the authors get this sample from just one particular investor. This almost certainly introduces some sort of selection bias. However, the authors are well-aware of this issue and address it by comparing their sample to the Preqin database. Based on the summary statistics, they argue that the samples are actually quite comparable. While this is obviously helpful, I think we have to be somewhat pragmatic here in any case. Of course, we all want to have the perfect sample of the entire PE-industry. But reality just looks different. It is hard enough to get a clean sample of 395 PPMs, so we better analyze those than none at all.
With respect to methodology, the authors use various established tools from natural language processing and machine learning. As usual, I will not bore you with too many methodological details and focus on the (in my opinion) most important contributions of the paper. First, the authors explore and visualize the qualitative information of PPM strategy sections at a larger scale. Second, they construct machine learning models that turn conventional quantitative and the qualitative text data into predictions that help to select PE-funds. While I do believe that the results are still mostly indicative at this stage, I think the approach is very interesting and promising.
Important Results and Takeaways
There are a lot of empirical analyses and results in the paper. In the following, I only cover those which I believe are the main takeaways and refer to the paper for more details.
Portfolio Company, Management Team, Investment Opportunity – The most common words of PE-managers
The authors start by a simple visualization of the qualitative information in the strategy sections. For this purpose, they use the well-established Term Frequency – Inverse Document Frequency (TF-IDF) approach to identify the most common bi- and tri-grams from the 395 PPMs.3TF-IDF scores combine information about how often a token appears in one particular document, and how often it appears in the entire sample of documents. The following table summarizes the results. You may note that some of the terms have somewhat strange endings. This is because of stemming, a common procedure within natural language processing that prevents double-counting.4Without stemming, for example, we would count investment opportunity and investment opportunities as separate terms even though they are basically the same.
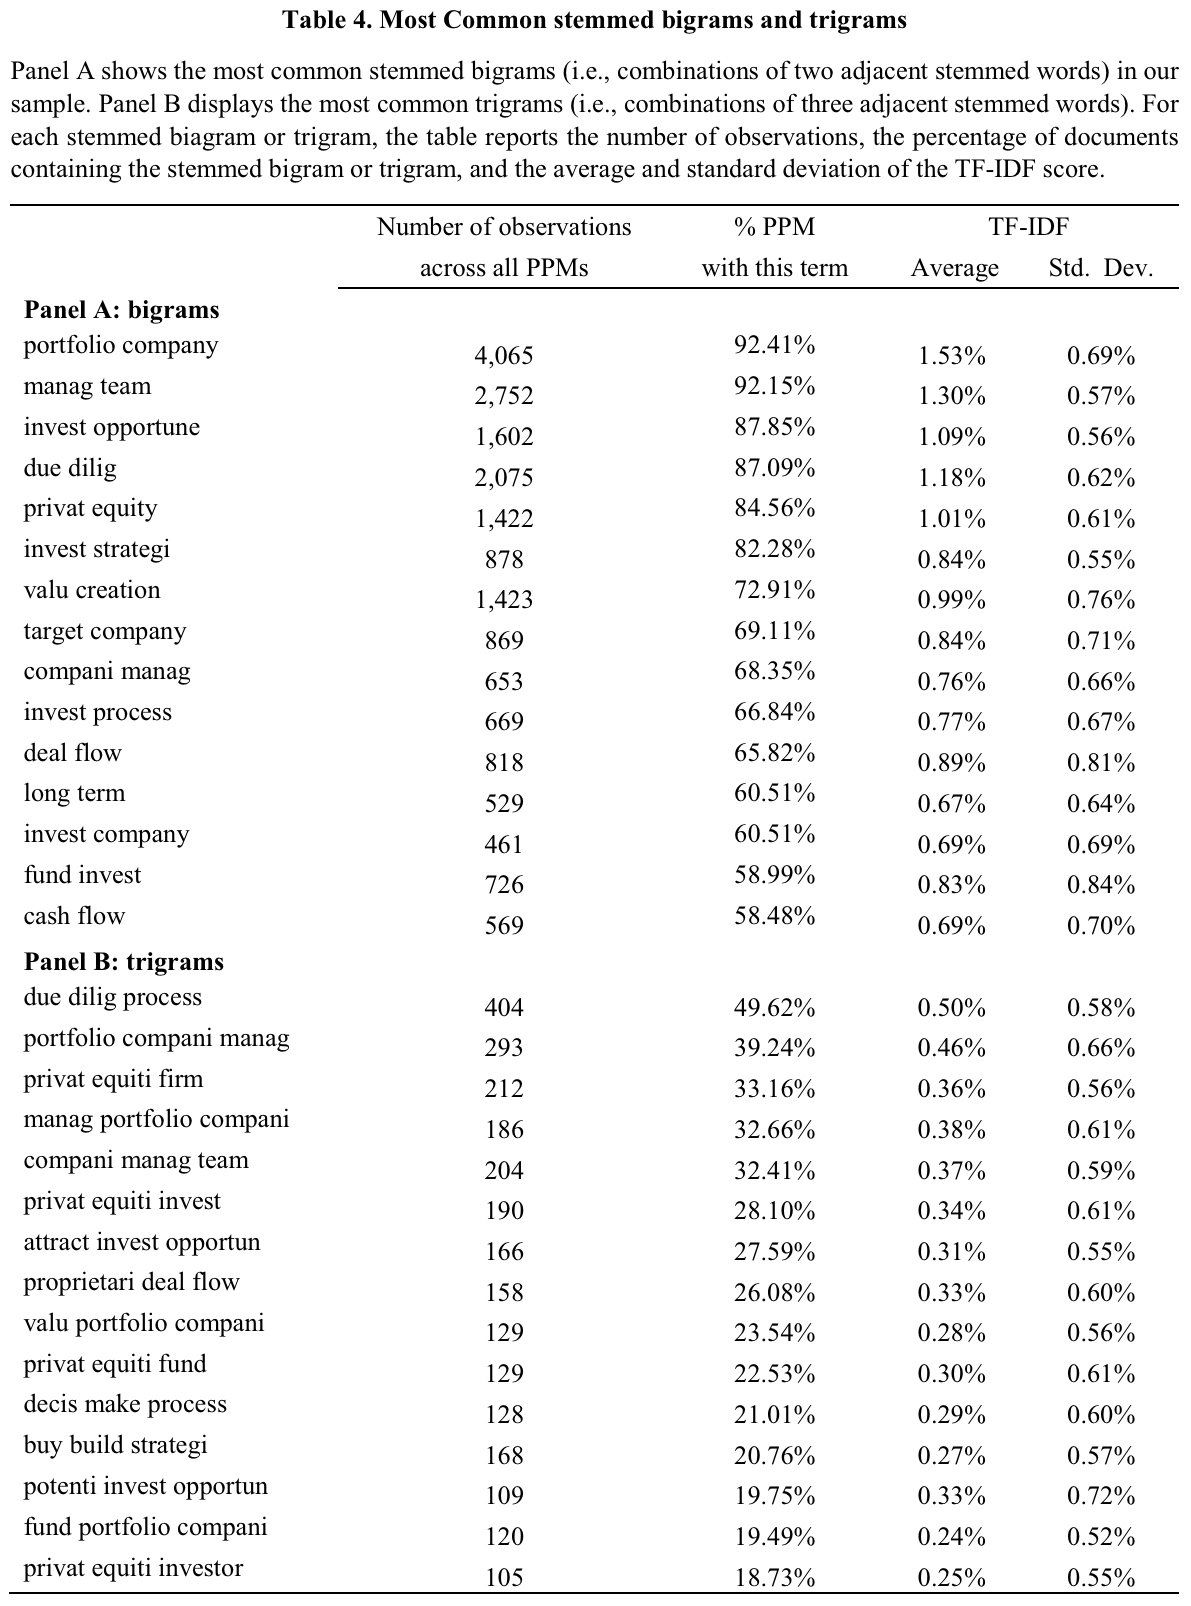
The table should be pretty self-explanatory and I believe all of the terms are quite reasonable in the context of private equity. The authors nonetheless mention some more interesting details. First, the relatively high standard deviations of TF-IDF scores indicate that the frequency of terms differs quite significantly across PPMs. So while these are the most common words on average, they are not necessarily the most common in every single strategy section. Second, a text-similarity analysis further reveals that the strategy sections of PPMs are remarkably stable since 2003. In addition to that, they do not depend on the lawyers that advise the respective PE-manager. This indicates that the PE-managers actually draft the strategy sections themselves and do not just report boilerplate.5PPMs advised by a given law firm exhibit an average cosine similarity of 30-50% where 100% represents completely identical documents.
The complexity of PE-fund documents is related to fundraising success and performance
The authors also present some indicative correlations of text, fundraising, and performance variables. For example, the complexity of PPMs and their strategy sections are negatively correlated to fundraising success. As the highlighted numbers in Panel B of Table 1 above show, funds with longer PPMs and strategy sections tend to have longer fundraising periods and tend to be less oversubscribed. Even more important, longer PPMs also indicate worse fund performance as the number of pages correlates negatively with performance measures like TVPI or IRR. This is actually in-line with existing results for public markets and in my opinion quite intuitive. If your fund manager needs dozens of pages to explain what she is doing and cannot articulate the investment idea in clear words, the strategy is probably not good enough.
Machine learning and text data helps to select PE-funds
The authors next present their machine learning setup to examine the information in the PPM strategy sections and their additional value beyond standard information about past performance and fundraising. They use three common algorithms (LASSO, Random Forest, Gradient Boosting) and train them with the performance data of 323 funds raised before 2013. The remaining 72 funds serve as the out-of-sample test. The target variable for the algorithms is a dummy that equals one if the TVPI of a fund is larger than the median TVPI of funds with the same vintage year and investment strategy in the Preqin database (i.e. an excess TVPI > 0). The models thus produce an expected probability for outperformance and the authors intuitively use 50% as the cut-off to define expected out and underperformers.
Before going into the results, let me briefly be the spoilsport and comment on a few methodological issues. This is no critique as the authors are well-aware of these challenges and comment them extensively. They are nonetheless very important to keep in mind when looking at the results.
First, the classification setup neglects a considerable amount of information. For example, a fund that realizes a TVPI of 1.6 a benchmark of 1.5 would be considered equally successful like a fund with a TVPI of 2.5 even though the last one is clearly better. Second, and this is the most important, the base specification of the training sample suffers from look-ahead bias. The authors train their models on performance data that wasn’t actually available at that point in time. While this is of course not best-practice, it is difficult to prevent such problem for PE-funds. For a true out-of-sample test, the authors explain that they could only use funds raised until 2007 with performance available as of 2013. Needless to say, the PE industry changed a lot over the last decade and there is an inevitable trade-off between including more and more recent data versus having a true out-of-sample test. In their base specification, the authors decide for more data but also report the true out-of-sample test as additional robustness. I think this is intellectually honest and the best they can do with a small sample of funds that require multiple years to evaluate performance.
By and large, all machine learning models perform quite well and generate goodness-of-fits and accuracies well-above common benchmarks.6The area under the ROC curve amounts to 0.57-0.66 for the Pseudo Out-of-Sample Fit. An area of 0.5 is the benchmark of a random 50-50 guess.What does this mean? Well, it means that using the machine learning models to determine whether a fund is going to outperform is statistically more reliable than a random 50-50 guess. This is of course quite promising, but not sufficient if you put yourself in the shoes of a fund selector. We obviously want to know what this means in terms of money and performance. The following table provides an overview.
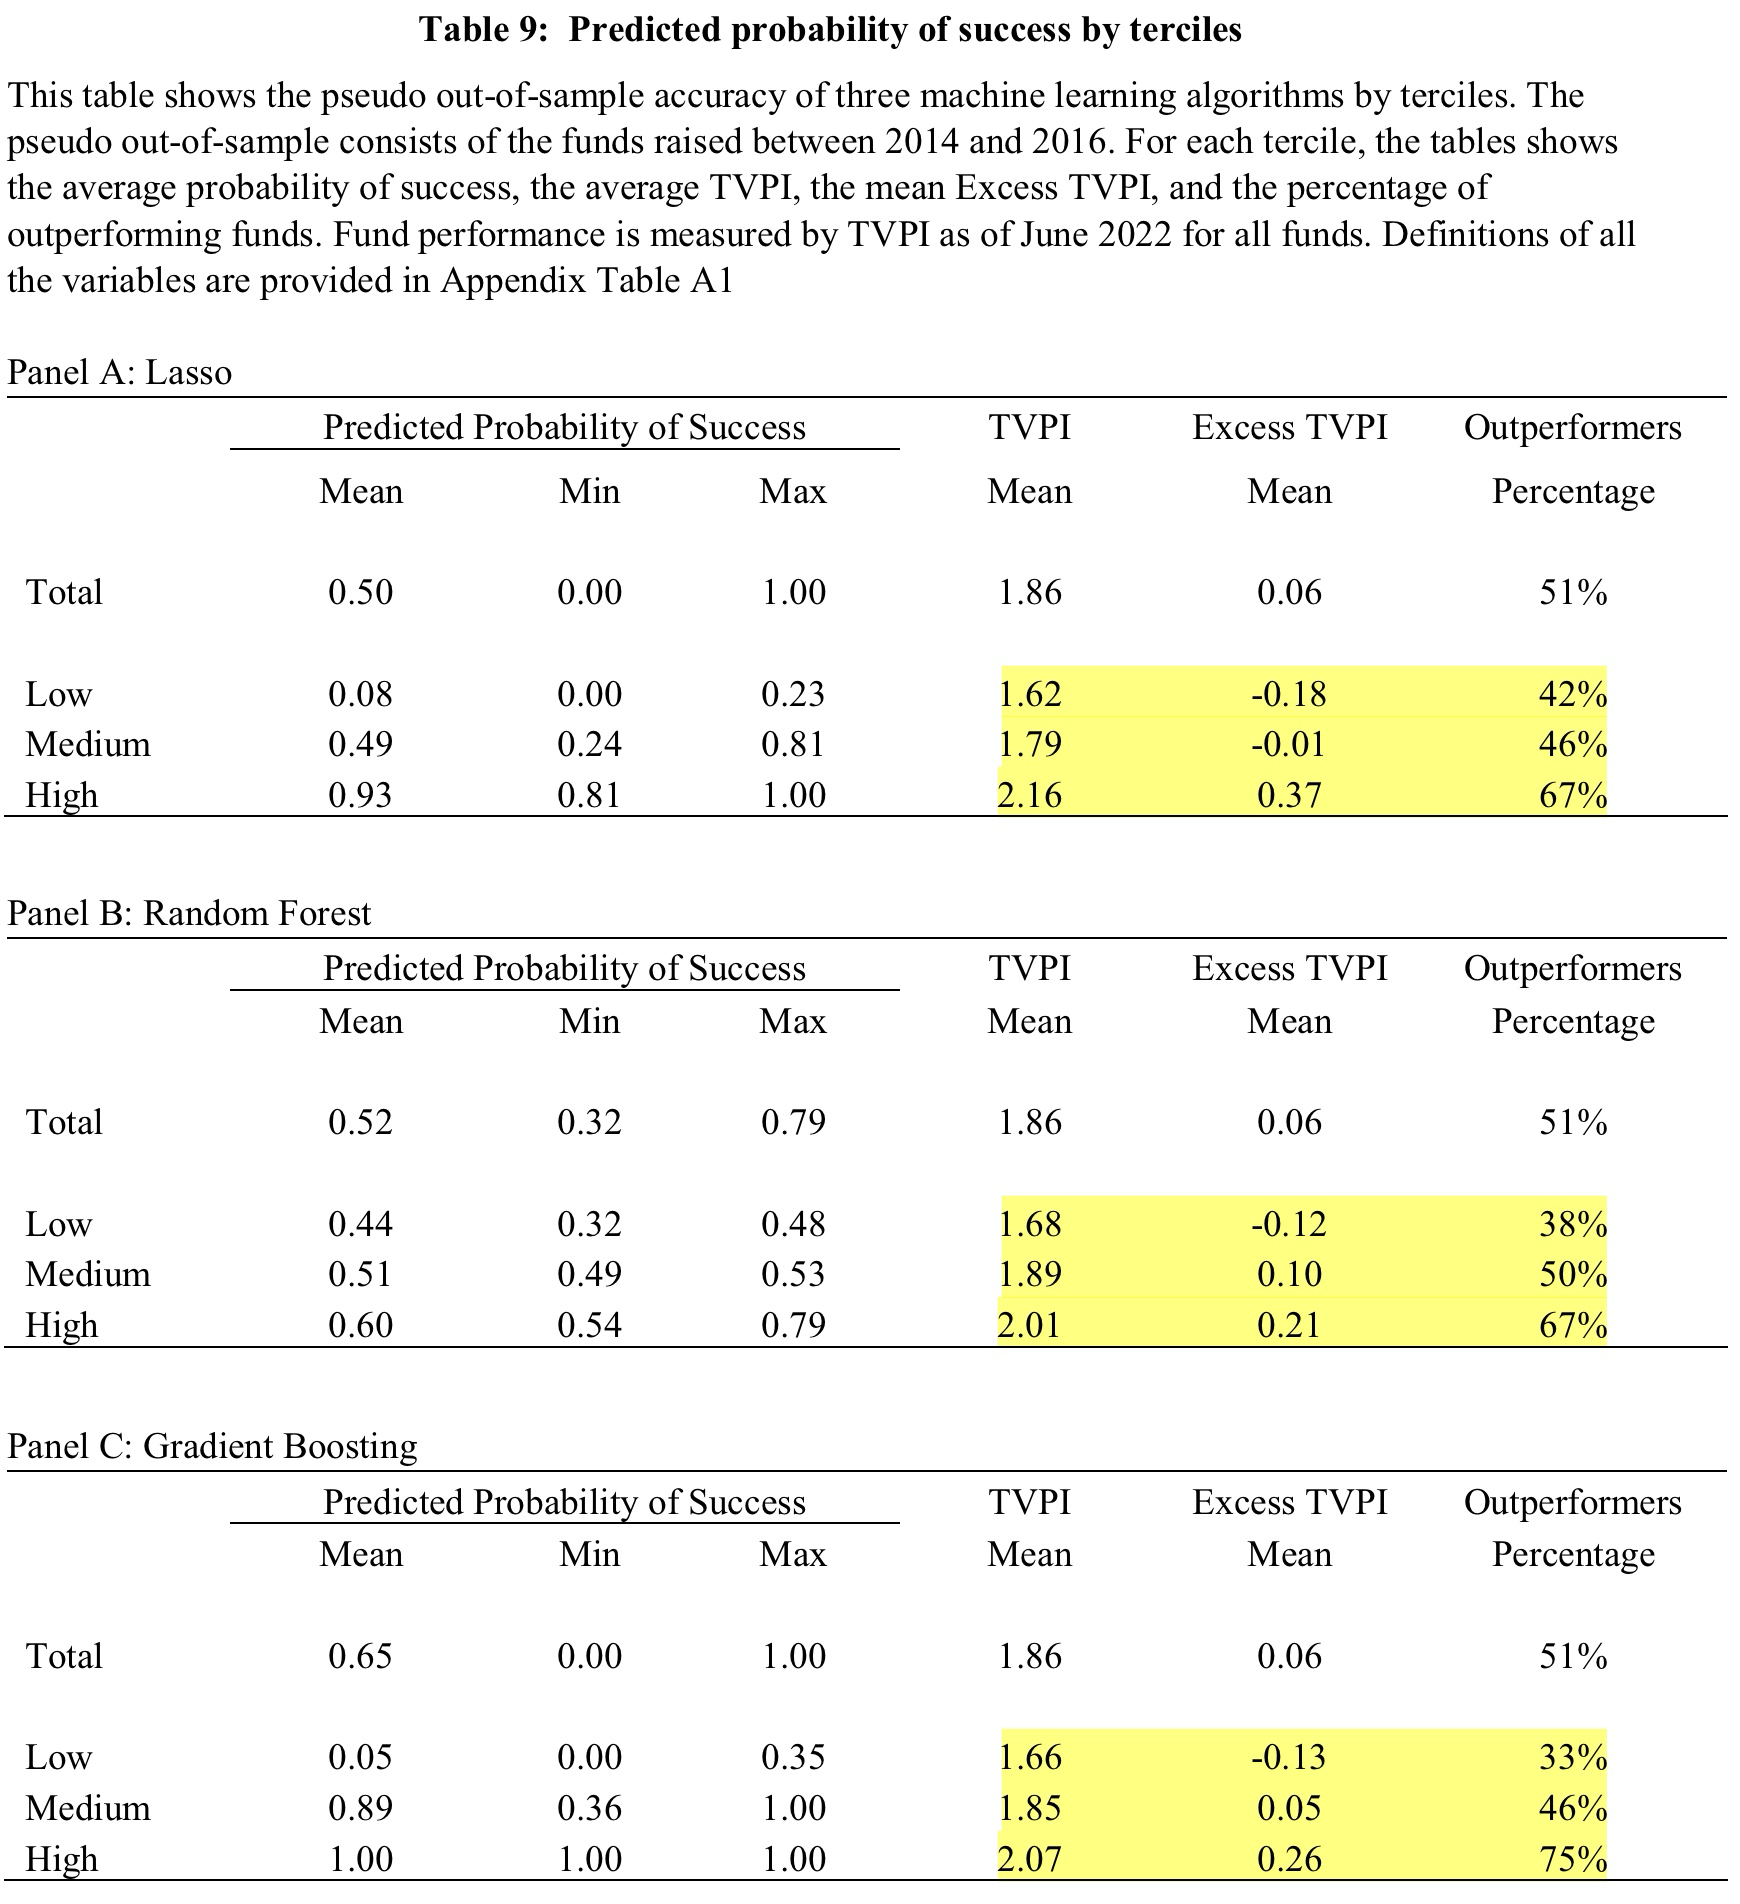
The authors first mention that the predicted probabilities for a positive excess TVPI fall into three clusters. They label them Low, Medium, and High. The highlighted numbers in the tables above show some performance statistics for each of those terciles. For example, 75% of the PE-funds that the Gradient Boosting algorithm (Panel C) predicts to be outperformers do actually outperform. The average TVPI of those funds is 2.07 which is 0.26 points or 13% higher than the benchmark. On the other hand, only 33% of predicted underperformers do actually underperfom. On average, however, those funds do realize a considerably lower TVPI than the rest of the sample.
This pattern is remarkably stable for all three algorithms. All of them seem to be better in identifiying winners. From a practical perspective, this is no problem and actually helpful because it is not possible to profit from shorting underperforming PE-funds. From a statistical perspective, however, it raises questions why the model accuracy is somewhat lopsided. With respect to the algorithms, the authors mention that the more advanced Random Forest and Gradient Boosting achieve better results than linear LASSO. Personally, I am very skeptical about picking the “right model” from backtests and I believe we should take a more robust ensemble from all of them if we ever put this into practice.
The authors again summarize the results and compare them to other, more rule-of-thumb-like, approaches for fund selection in the following chart. The figure shows the average TVPI for different percentile ranks of the PE-funds raised between 2014 and 2016 (the test sample). Starting at the very left, no funds (0%) are removed from the sample. So this is just the average TVPI. At the very right, only the top 25% of funds according to the following rankings remain in the sample. The black line ranks funds by the estimated probability from the Gradient Boosting algorithm, the blue dots are the ranking by fundraising success (the faster the better), and the gray line is the ranking by past performance (the higher the better). If you are like me, you needed this little introduction to not confuse the chart with a performance time series at first glance…
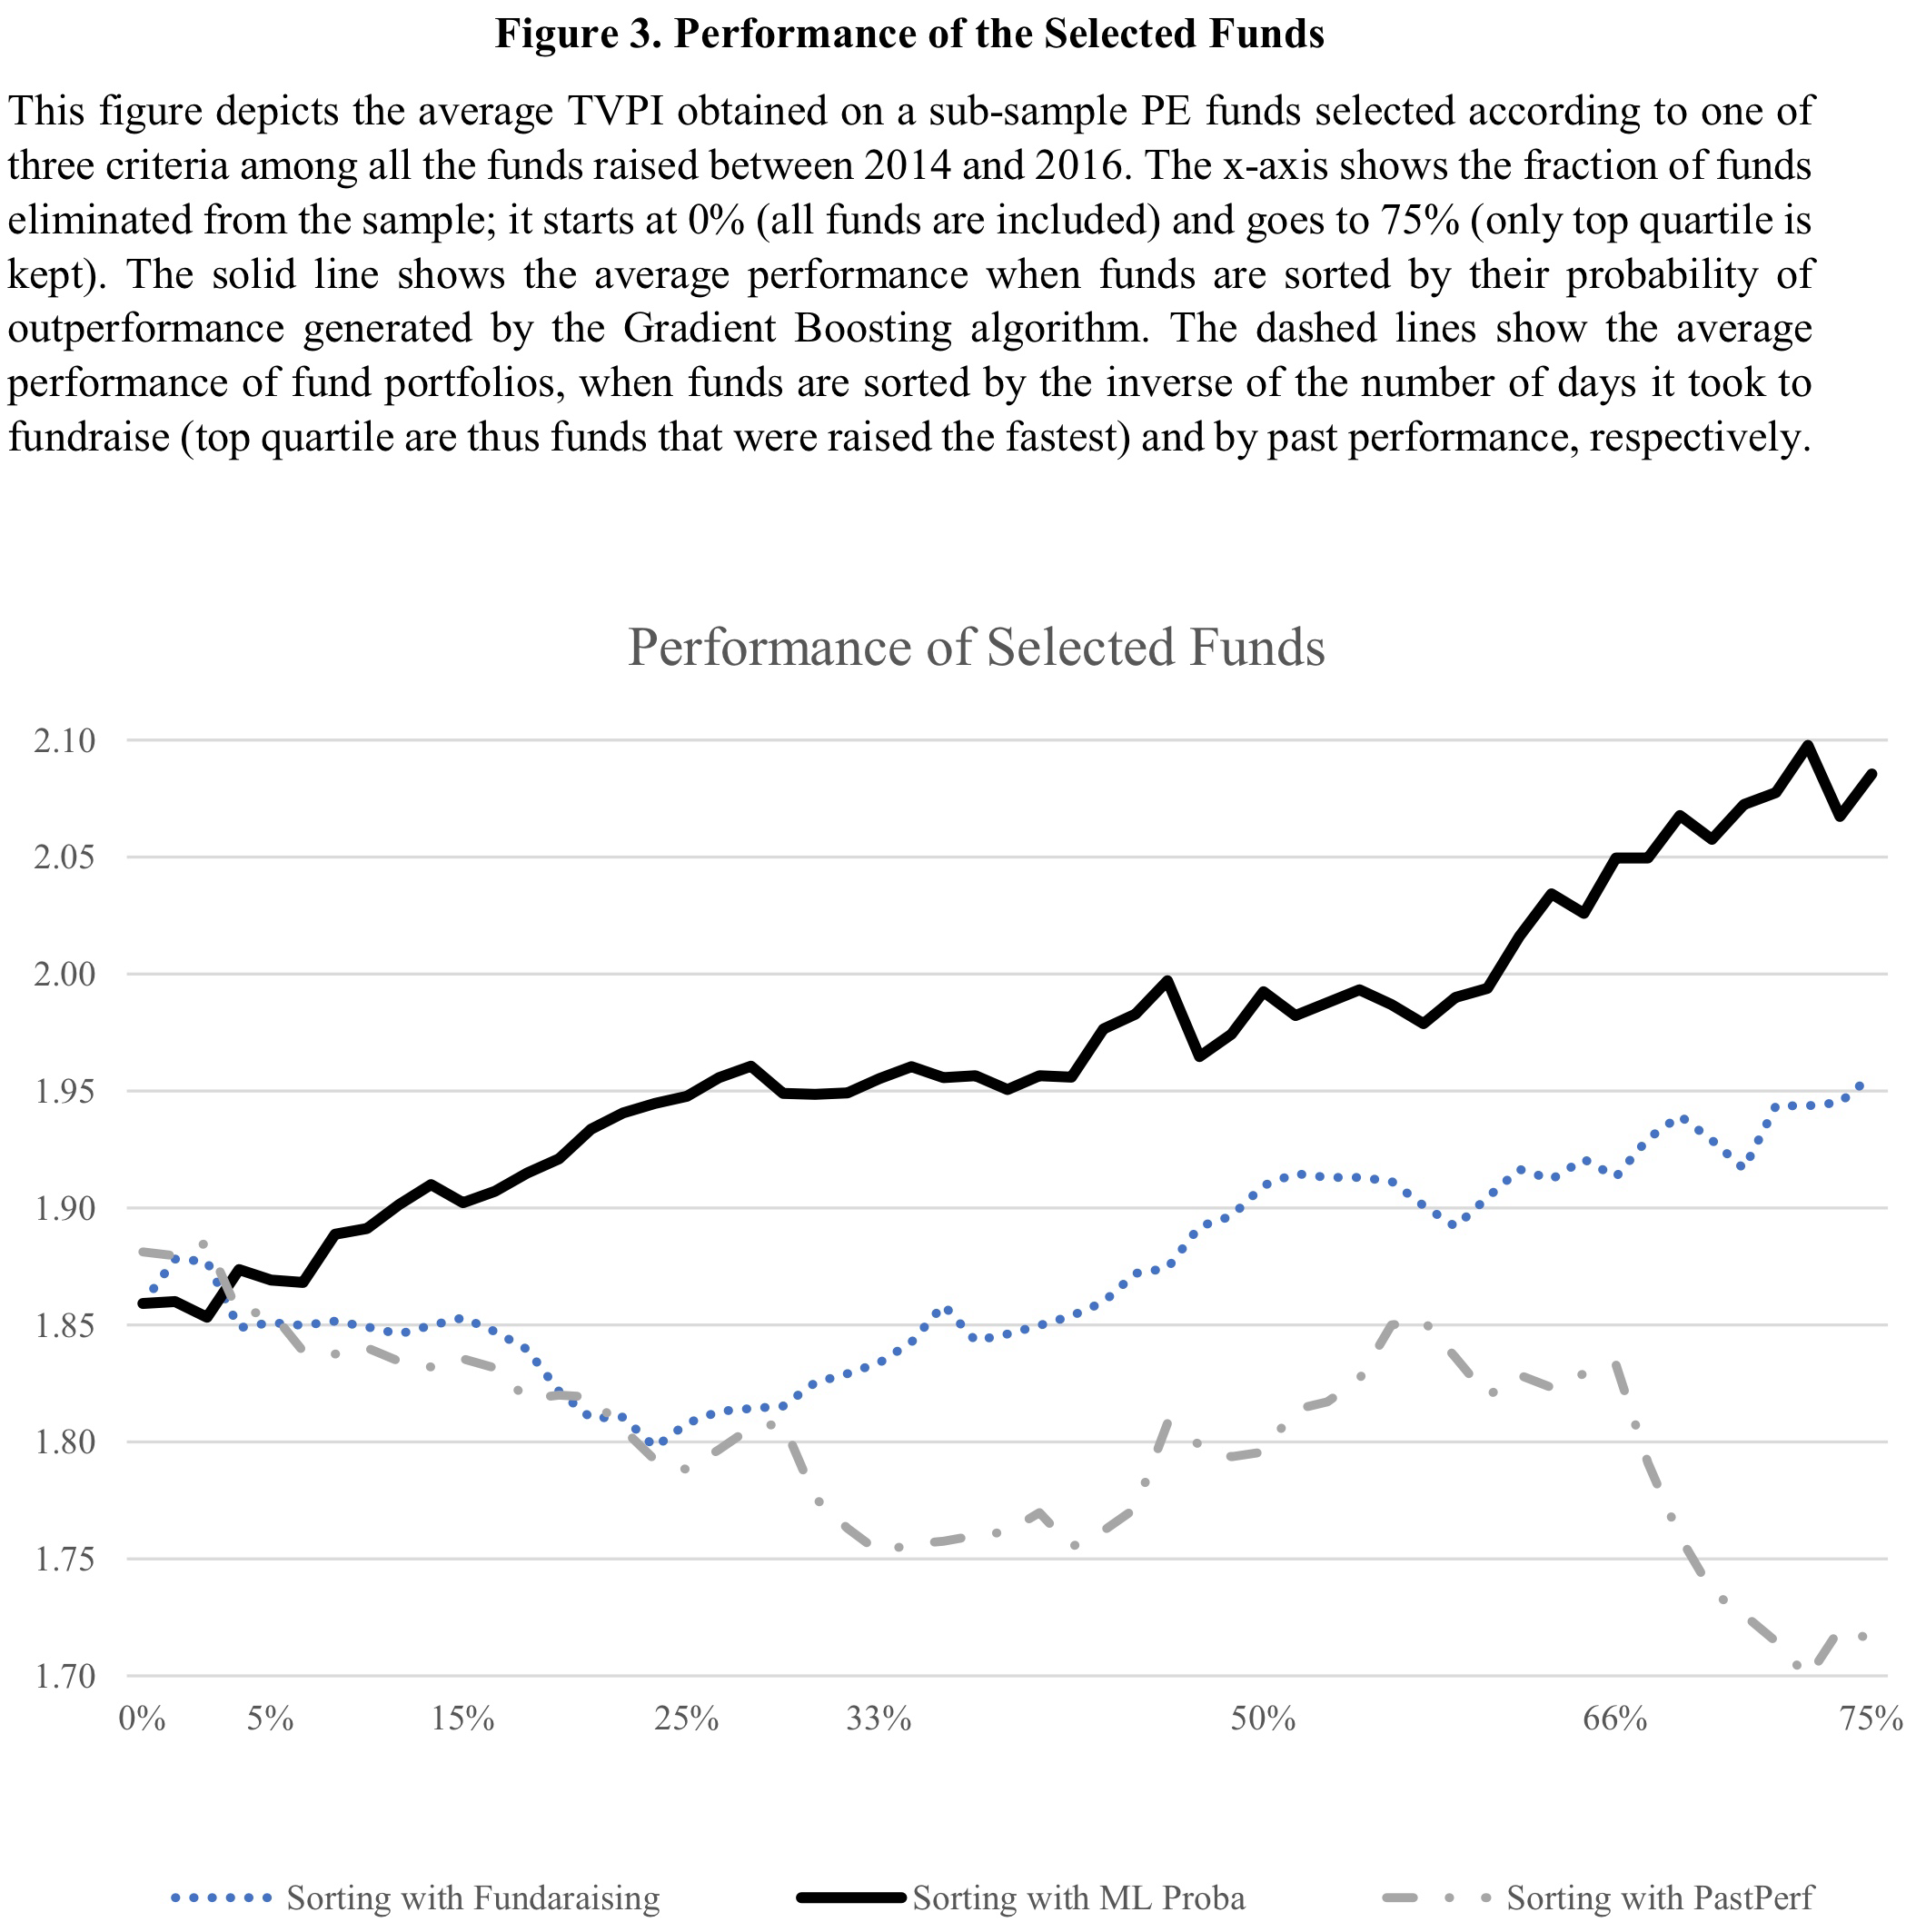
The results are (in my opinion) quite impressive. The 25% of PE-funds with the highest expected probability for outperformance generated an average TVPI of just under 2.10. This number is considerably higher than the average TVPIs of the top 25% by fundraising success (1.95) and past performance (1.72). In addition to that, the machine learning predictions generate a pretty stable monotonic relation along the universe. This, of course, further increases the evidence that they are actually helpful for fund selection. Apart from that, however, the chart also shows that non-machine learning fund selectors should rather pay attention to the fundraising success of PE-funds than their past performance.
The machines seem to pick up meaningful concepts
In of the additional tests and analyses, the authors briefly explore which of the text features are driving the predictions of the machine learning models. They rely on well-established methodology and report SHAP values of the most important terms in the following chart.
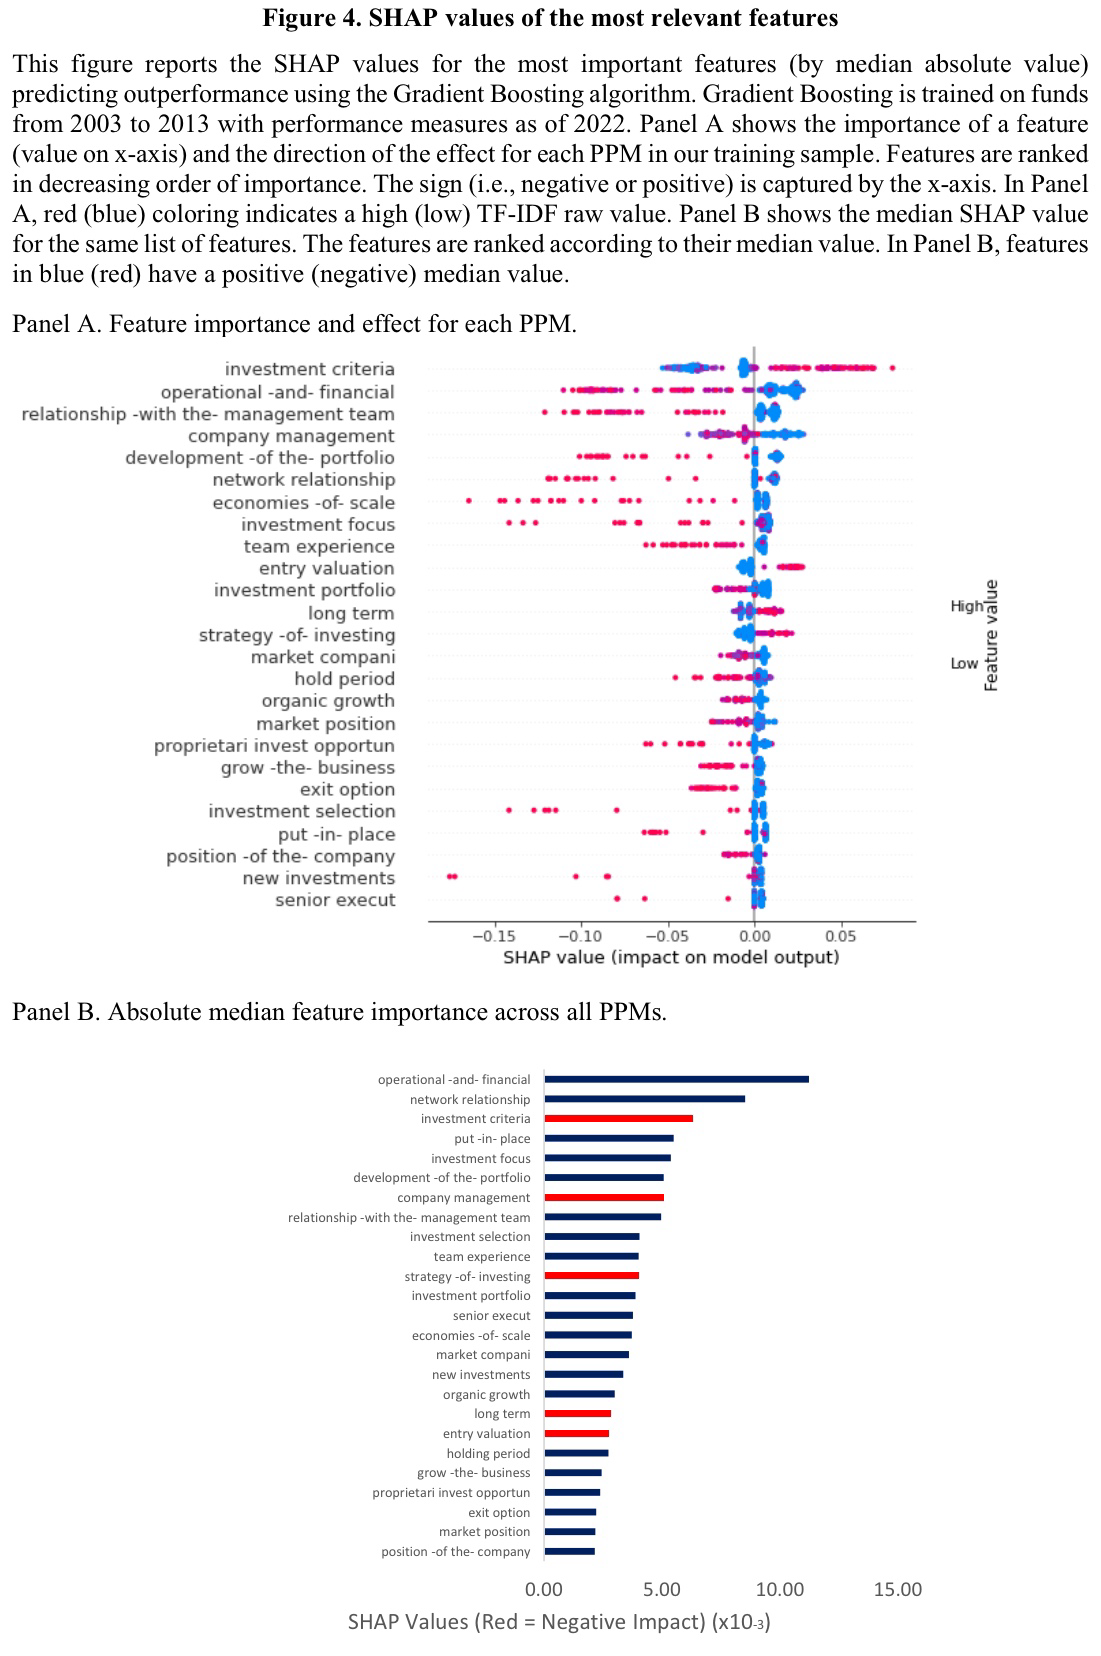
I don’t want to go too deep into single terms and interpretations as it is generally challenging to make statements about marginal effects in non-linear machine learning models. The main takeaway, in my (and the authors’) opinion, is that the algorithms seem to pick up economically reasonable concepts. Again, these are obviously good news and serve as a plausibility check. The authors also mention that very generic terms (e.g. investment criteria) tend to be negatively correlated with predicted outperformance. Features with positive impact on predicted outperformance, in contrast, tend to be related to well-known value creation approaches in the PE industry (e.g. network relationship).
Conclusions and Further Ideas
This post got much longer than I expected and planned it to be. Part of the reason, as I mentioned in the beginning, was that I am not very experienced in private equity and had to look up some basics. Nonetheless, I think the paper is very interesting and contains a lot of practical insights. First, the authors shed light on the information in otherwise private and confidential documents at a larger scale. Second, they show that qualitative text information can add significant value beyond standard performance and fundraising data for private equity fund selectors. Third and finally, they explore the application of modern quantitative methods that have become standard in public markets in a novel private market setup. Apart from that, the authors also create various interesting statistics about the private equity industry along the way.
While the results are of course very promising and go in a clear direction, applying quantitative methods and in particular more advanced stuff like machine learning to private markets remains challenging. I mentioned several times on this website that with few exceptions, even public markets are not the best playing field for machine learning because of small data. This problem is of course even more relevant for private markets. Although it is the best they can do, the authors’ sample of 395 PE-funds is simply too small for models that work best with thousands or millions of data points.
Having said that, I personally believe that it is inevitable that quantitative methods will find their way into private markets over the next years. Yes, it is currently difficult to apply them, but the flip side is a larger reward for innovations that overcome the difficulties. I think we are already seeing the start of this development as more and more reliable data about private markets becomes available. Open-minded fund selectors can certainly position themselves to profit from such a development. I mean, who doesn’t want to improve the own practice by borrowing methods that have been successful elsewhere for a long time now? Of course, it doesn’t have to be a fully automated machine learning fund selection. But using readily available natural language processing on PPMs to support human decisions seems to be a no-brainer. By starting now, we may have the advantage of using such things while they are not yet standard in private markets. And as we know, things are typically more profitable before they become standard…
- AgPa #83: How Much of the US Market is Passive?
- AgPa #82: Equity Risk Premiums and Interest Rates (2/2)
- AgPa #81: Equity Risk Premiums and Interest Rates (1/2)
- AgPa #80: Forget Factors and Keep it Simple?
This content is for educational and informational purposes only and no substitute for professional or financial advice. The use of any information on this website is solely on your own risk and I do not take responsibility or liability for any damages that may occur. The views expressed on this website are solely my own and do not necessarily reflect the views of any organisation I am associated with. Income- or benefit-generating links are marked with a star (*). All content that is not my intellectual property is marked as such. If you own the intellectual property displayed on this website and do not agree with my use of it, please send me an e-mail and I will remedy the situation immediately. Please also read the Disclaimer.
Endnotes
| 1 | A standard data-provider for private markets investments. |
|---|---|
| 2 | They exclude funds with vintage years after 2016. As I am also a tourist in this asset class, I had to look up the jargon. Vintage is the year in which funds deploy capital for the first time. This is not necessarily the year of fundraising. Funds that completed fundraising but haven’t made an investment so far are those with what the press usually calls dry powder. |
| 3 | TF-IDF scores combine information about how often a token appears in one particular document, and how often it appears in the entire sample of documents. |
| 4 | Without stemming, for example, we would count investment opportunity and investment opportunities as separate terms even though they are basically the same. |
| 5 | PPMs advised by a given law firm exhibit an average cosine similarity of 30-50% where 100% represents completely identical documents. |
| 6 | The area under the ROC curve amounts to 0.57-0.66 for the Pseudo Out-of-Sample Fit. An area of 0.5 is the benchmark of a random 50-50 guess. |