
Can exchange traded funds be used to exploit industry and country momentum? (2013)
Laura Andreu, Laurens Swinkels, Liam Tjong-A-Tjoe
Financial Markets and Portfolio Management, URL/SSRN
Even if you believe in factor investing, it is very difficult for most investors to actually implement it. Trading portfolios with hundreds of stocks requires considerable infrastructure, enough money, and efficient transaction cost management. This is already a challenge for many institutional investors, so it is logically even more difficult for people like you and me. This week’s AGNOSTIC Paper addresses this issue and presents an idea to still benefit from momentum via equity indices and the corresponding ETFs.
Everything that follows is only my summary of the original paper. So unless indicated otherwise, all tables and charts belong to the authors of the paper and I am just quoting them. The authors deserve full credit for creating this material, so please always cite the original source.
Setup and Idea
This week’s paper is both an out-of-sample test and a potential practical implementation of momentum. If momentum is indeed a robust phenomenon, we shouldn’t only find it for stocks, but also among other assets.1The beauty of momentum is that it only requires price data to test it. Therefore, you can apply it to virtually anything that has a price. Equity indices that represent countries or industries are a natural candidate to test this. Nowadays, there is a large literature on such out-of-sample tests. Back in 2013, however, this week’s authors were among the first who tested such country and industry momentum with actually investable ETFs.
For the greedy non-academics among us (including the writer), the much more interesting implementation is of course that we may be able to earn momentum profits without the hustle of trading hundreds of stocks.2Nowadays, there are also ETFs that track momentum indices. That is of course a step in the right direction, but usually those indices come with several methodological issues. Thanks to online brokers, it is now very easy and cheap to trade ETFs. Country and/or industry momentum could therefore be a viable implementation of momentum for individual investors like you and me. While this doesn’t sound too bad, the paper (as most of the time) is only a starting point and we need to do some more work before putting real money behind the strategy.
Data and Methodology
The authors use a bunch of different equity indices and the corresponding ETFs to test both industry and country momentum. As the track records of ETFs are naturally shorter than those of the underlying indices, they do two separate analyses to use as much data as possible. Theoretical backtests with non-investable equity indices and backtests with actually investable ETFs. I think this is a very reasonable approach and the best they could do.
For the theoretical industry momentum, they use market-cap weighted returns of 10 SIC-industry portfolios from Kenneth French’s website for a sample period from 1926 to 2009. For the theoretical country momentum, they use 16 well-known MSCI country indices from developed markets within the period between 1970 and 2009.
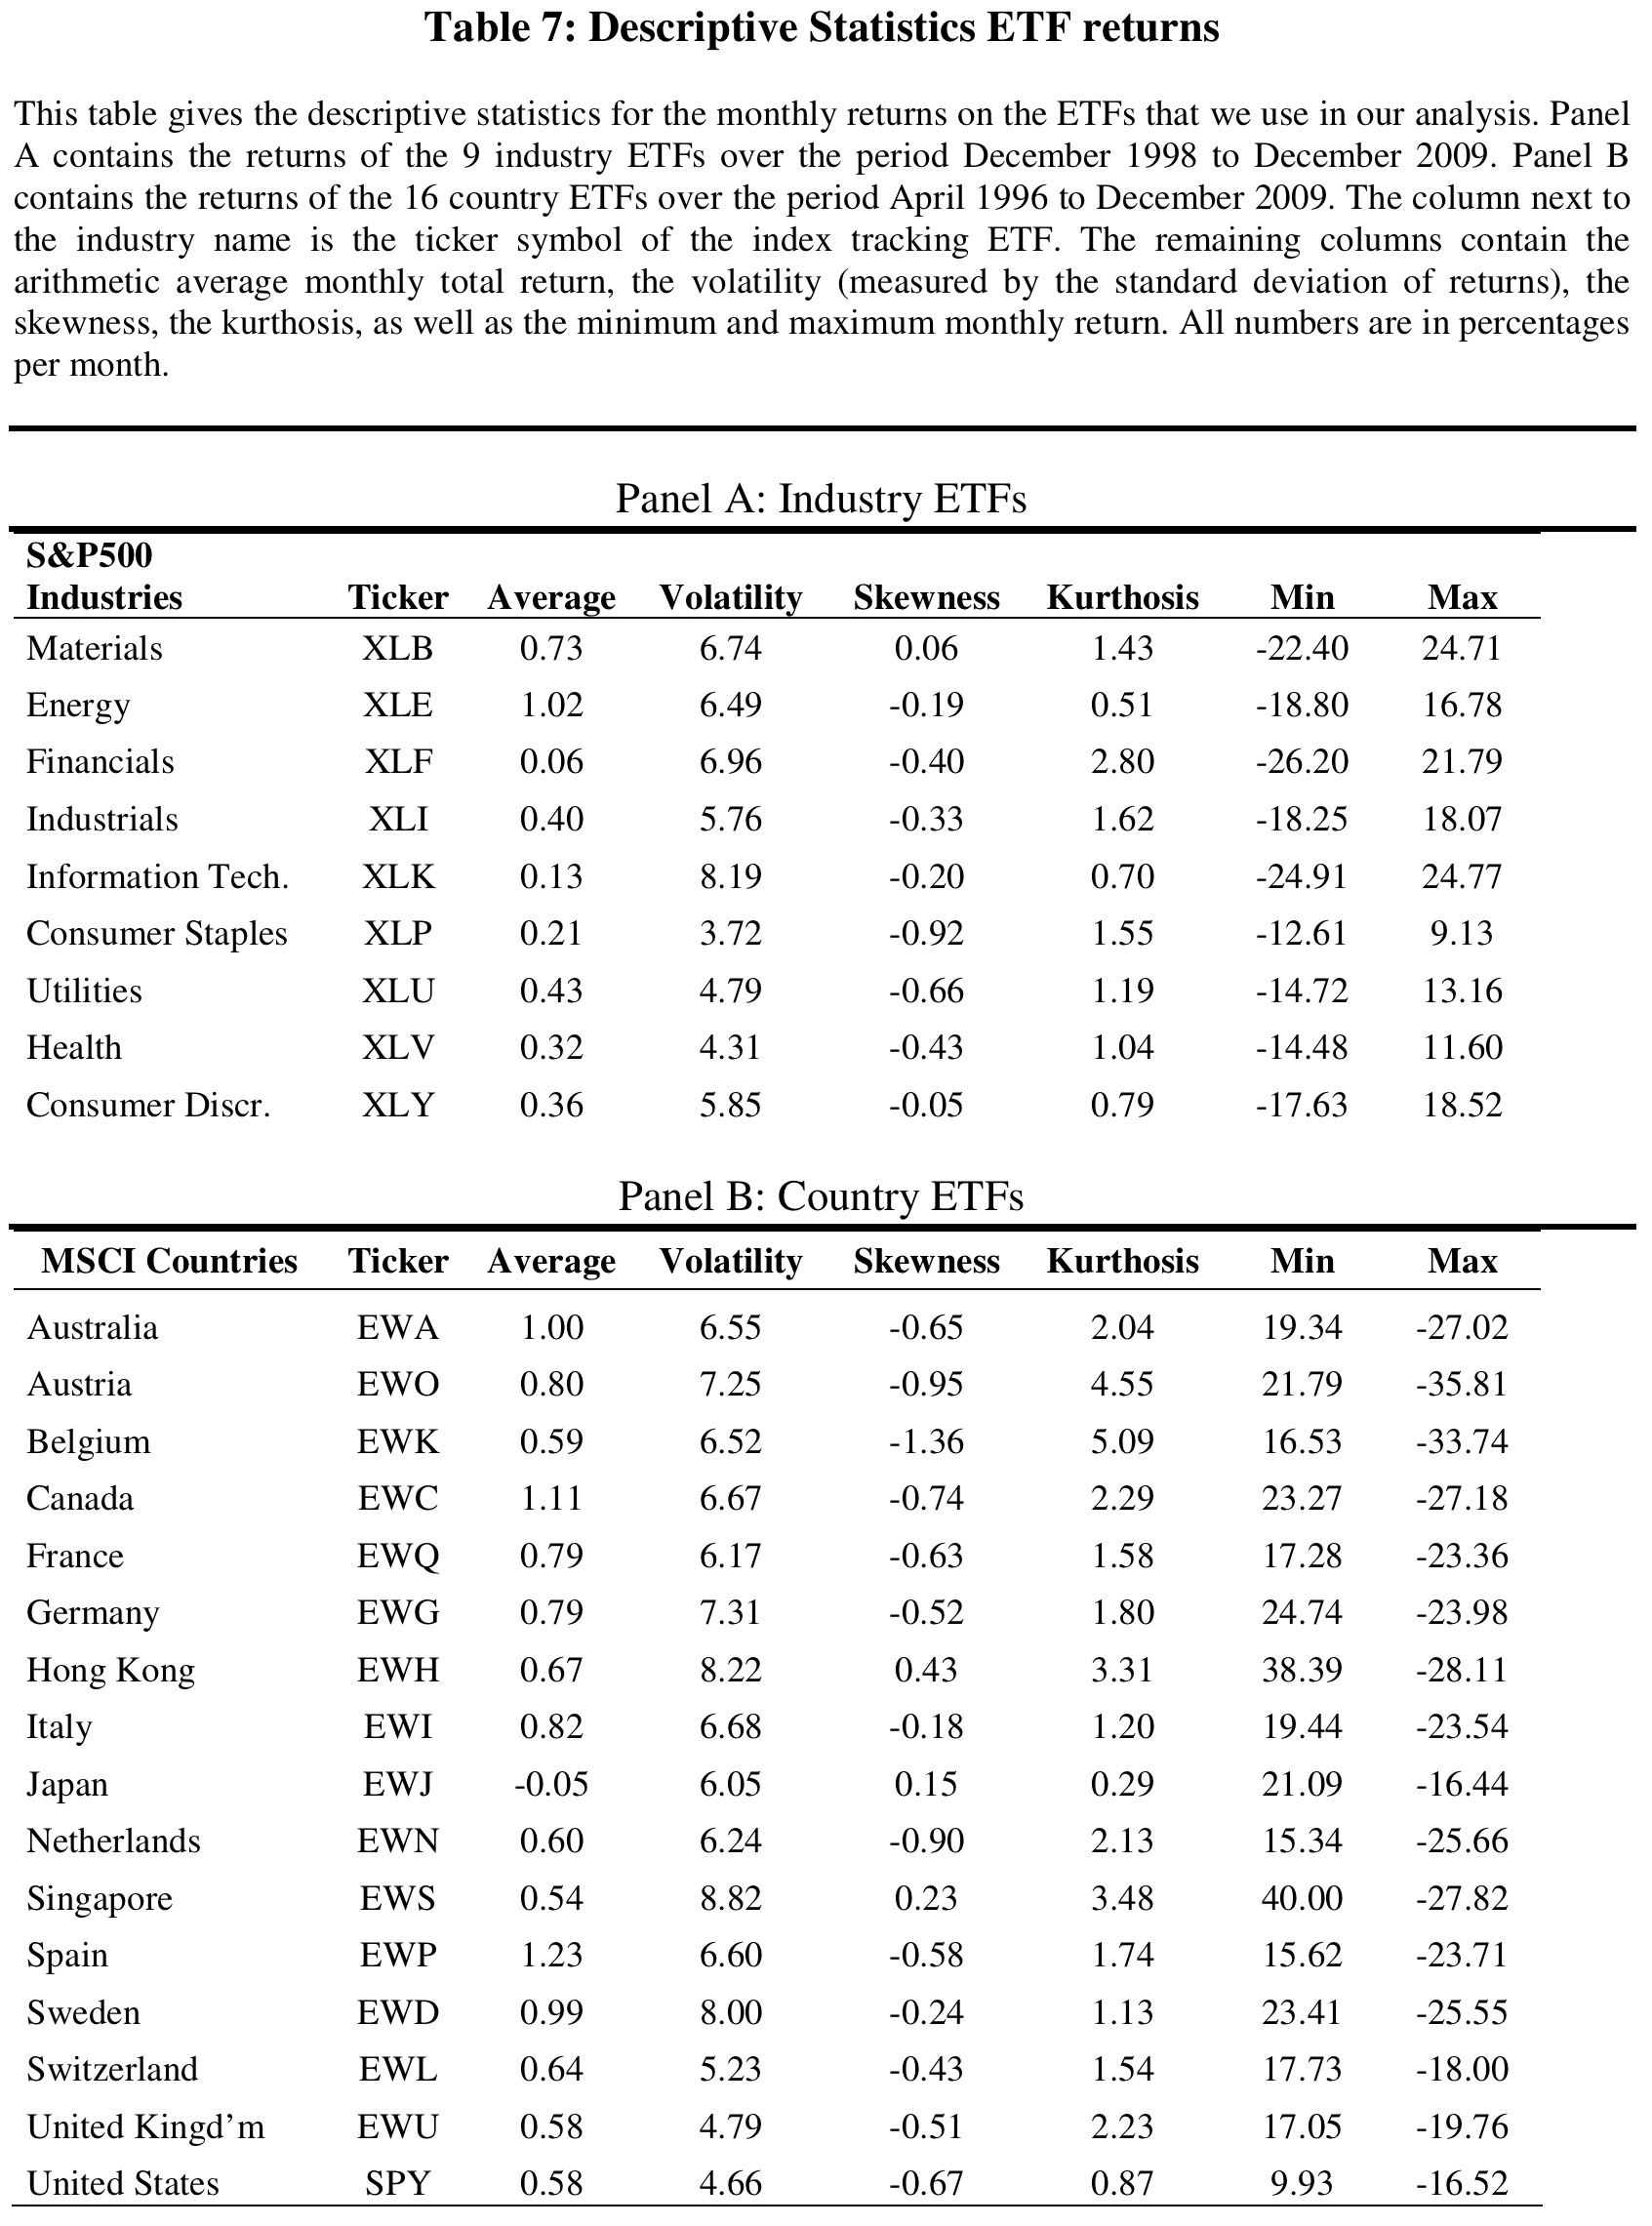
For the practically more relevant and investable backtests, the authors use the following ETFs as proxy for the theoretical indices.3A funny side note: The authors explain in great detail what ETFs are and how they differ from mutual funds. Today, 10 years later, this is unthinkable and illustrates how asset management has changed over the last decade. Instead of the SIC-industries for the entire US market, they use 9 sector ETFs that together include all stocks of the S&P 500 index. Those indices are market-cap weighted with a maximum of 20% per stock to avoid excessive concentration. For the 16 MSCI country ETFs, there are no major differences to the theoretical indices. The following table provides some summary statistics about the ETFs’ risk and returns. The sample period for the S&P 500 sector ETFs is December 1998 to December 2009, and April 1996 to December 2009 for the MSCI country ETFs.
So much to the universe. Just to get everyone on the same page, the idea of momentum remains exactly the same as for single stocks. We rank the indices and ETFs by their recent return and go long (short) those industries and countries with the most (least) favorable momentum. For this purpose, the authors follow the classic momentum methodology and use a combination of formation (J) and investment periods (K).4According to the authors, this methodology comes from the original momentum paper by Jegadeesh and Titman (1993). Let me explain. The (J = 12, K = 3) strategy, for example, means we invest in the indices with the highest 12-month performance and hold them for 3 months. If you want, that is the typical 12-month-past-return momentum strategy with a 3-month rebalancing interval.
There is one difference however. The authors build up the portfolio more gradually and don’t use the typical deciles or quintiles (Invest in a portfolio of the X% assets with the highest momentum). Coming back to the (J = 12, K = 3) example, they invest 1/3 of the portfolio in the single equity index with the highest 12-month momentum at time t = 0. One month later, at t = 1, they invest another 1/3 in the index with the highest momentum at that point in time. At t = 3, they exit the investment in the very first index and the process starts again.
All of the following results build on this methodology. To be honest, I have not yet fully understood why the authors use the gradual build-up instead of the typical decile-portfolios with different rebalancing intervals. I guess it is because of turnover management, but I am really speculating here and haven’t analyzed the methodological differences in more detail.
Important Results and Takeaways
Country and industry momentum worked historically
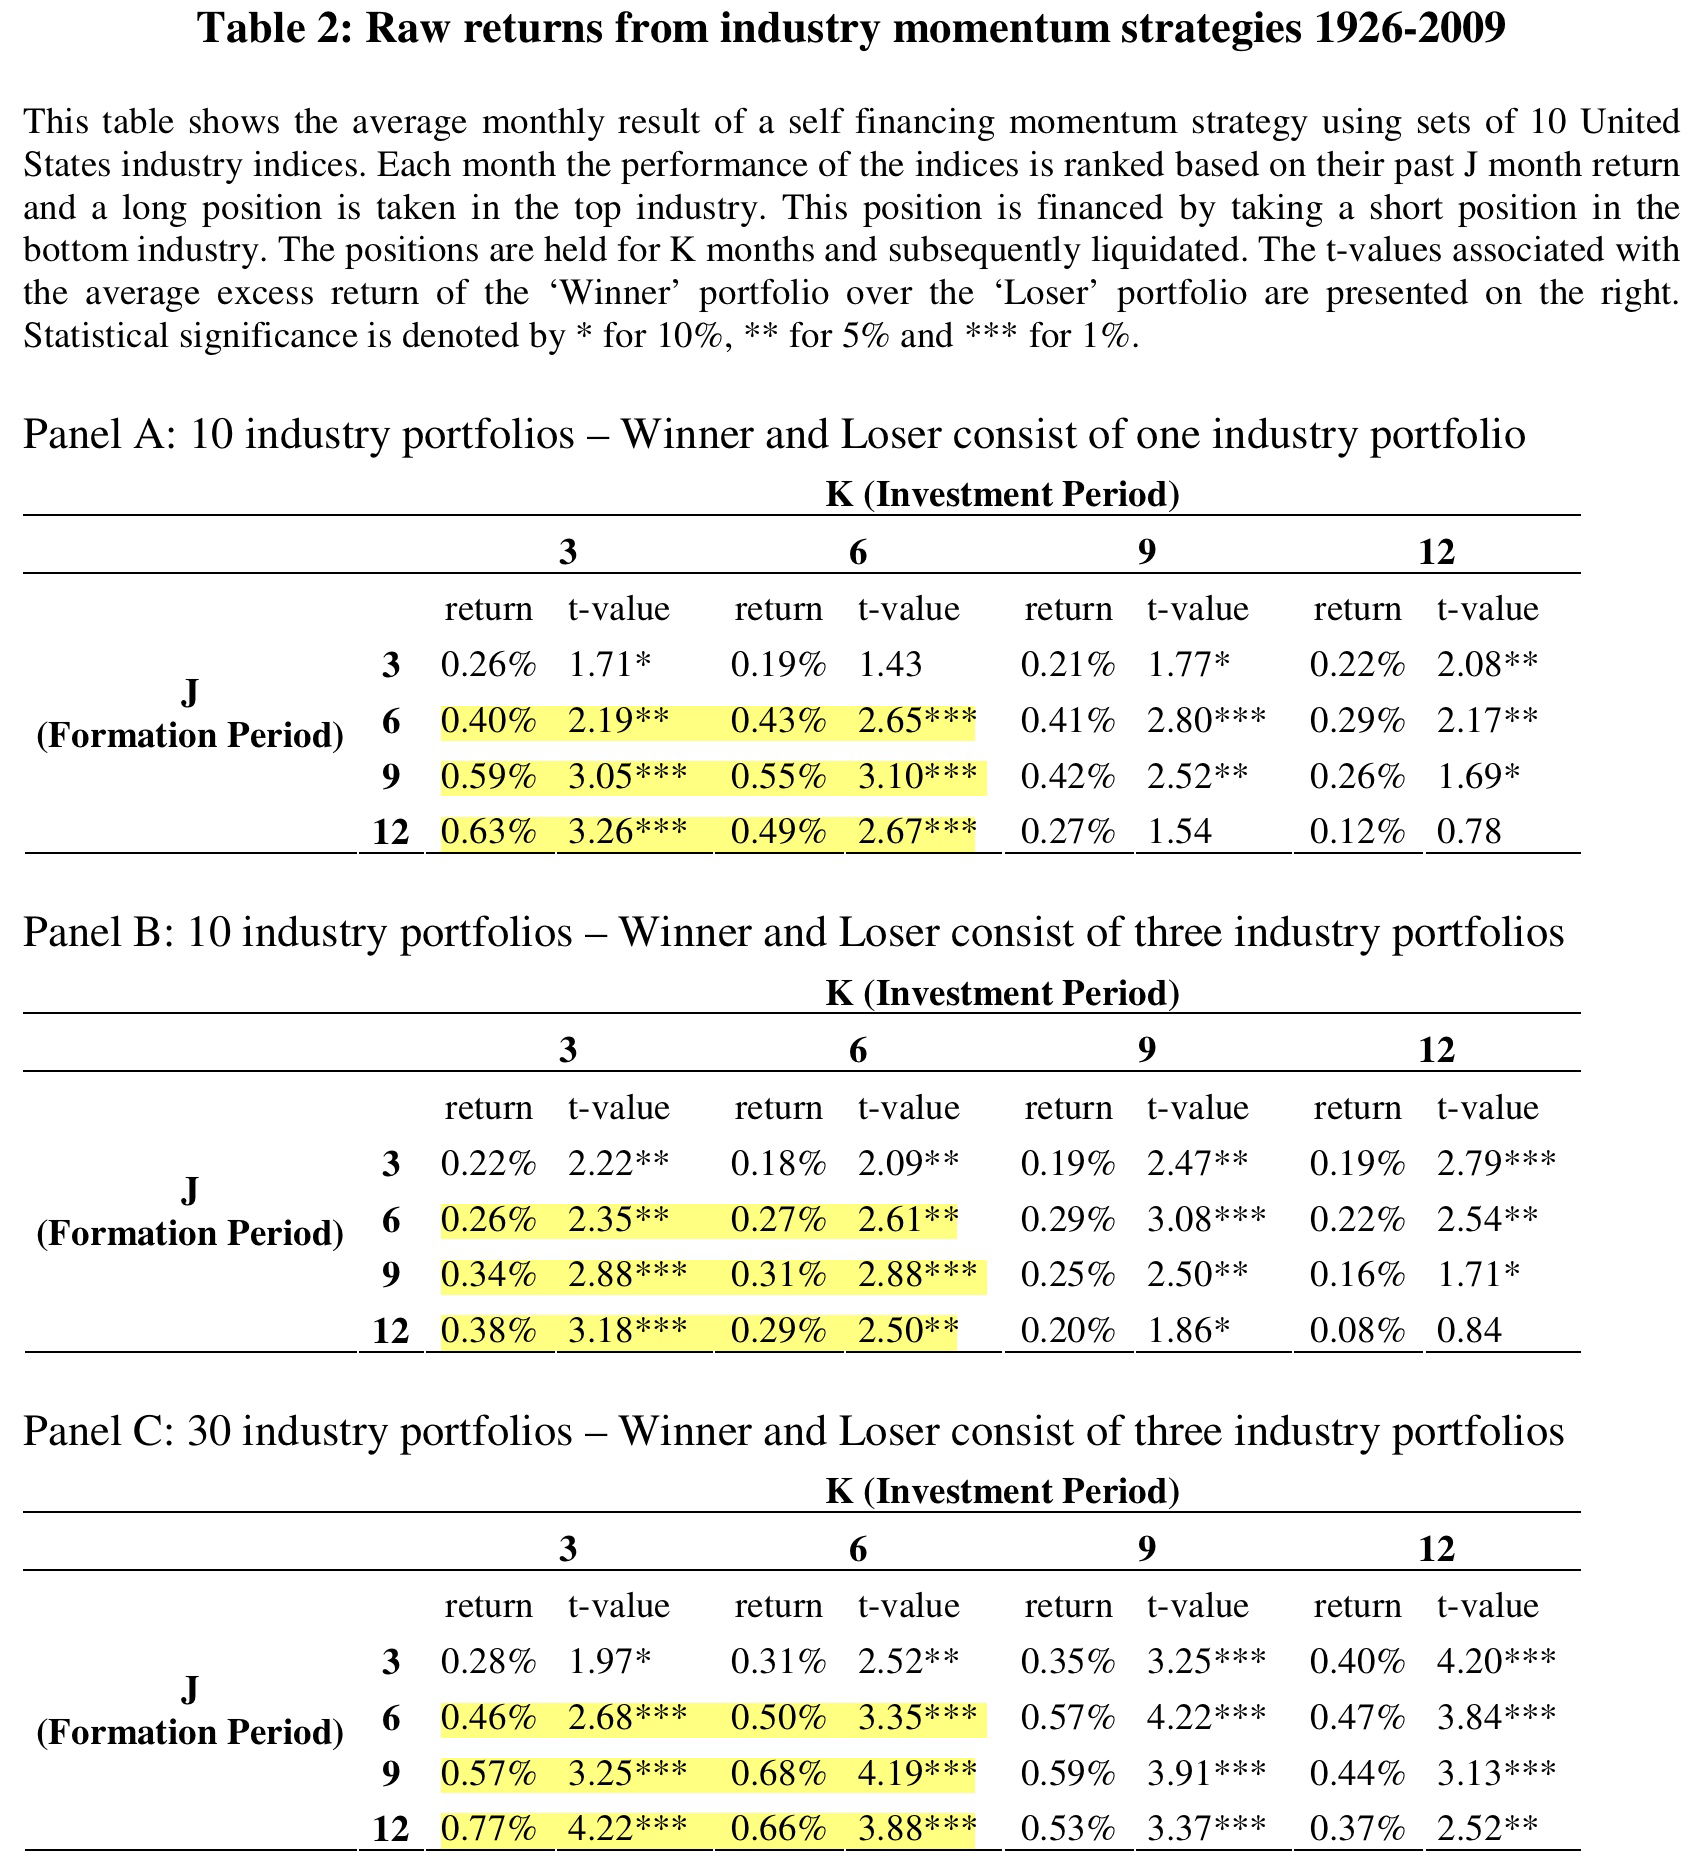
As mentioned earlier, the authors start with the non-investable momentum strategy among industry and country indices. The following table shows the average monthly returns for the hypothetical portfolio that is long (short) the US industries with the most (least) momentum. To make things easier, I highlighted the (in my opinion) most common momentum specifications in the table.
What do we see? For the highlighted specifications, the strategy generates sizable returns of 0.40% to 0.63% per month. Those are also strongly statistically significant with t-statistics larger than 2. Furthermore, those patterns are robust for slight changes in the methodology. For example, the positive returns persist when using the top (flop) 3 industries for portfolio construction or using a different, 30-industry classification. The magnitude, however, is somewhat smaller.
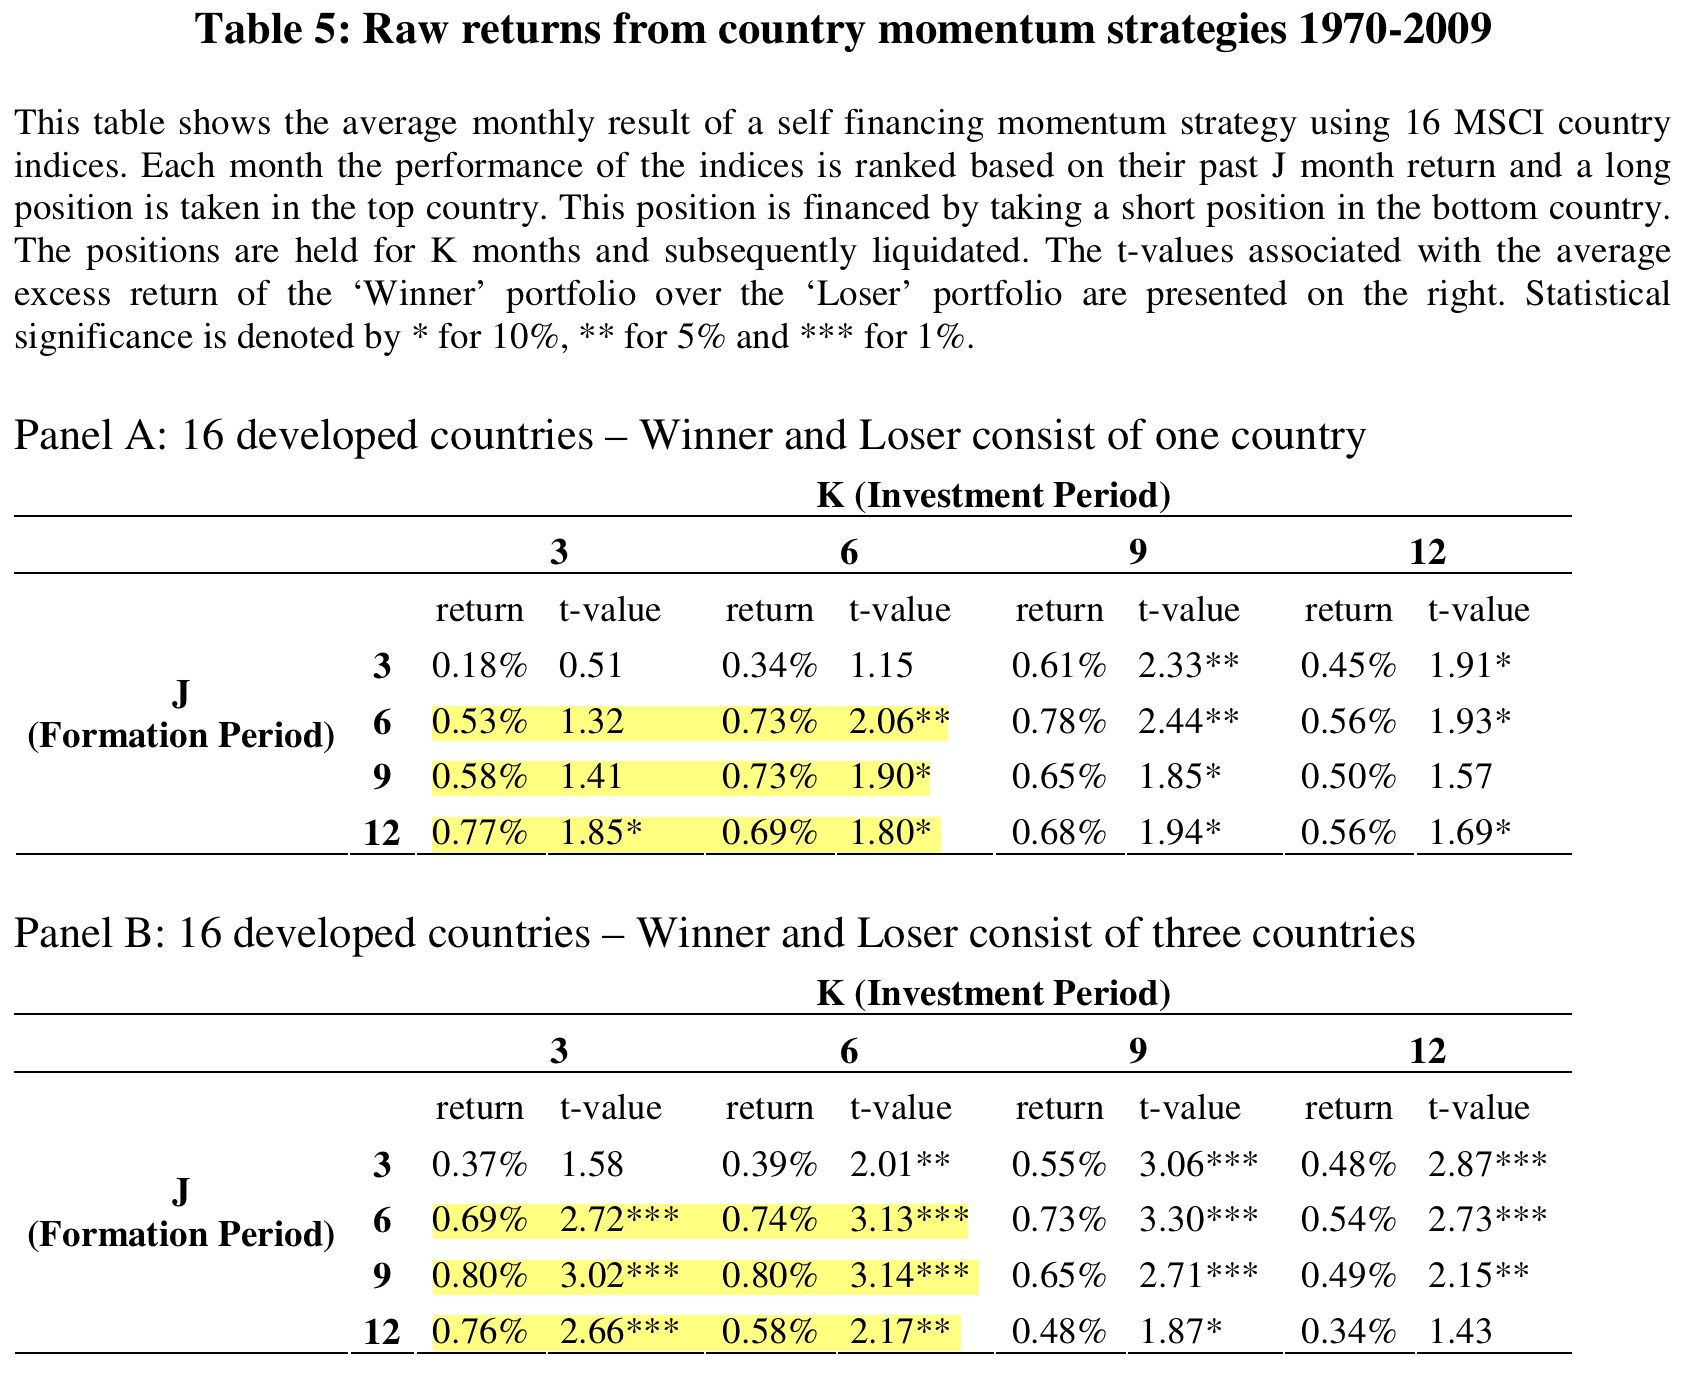
The next table shows the same numbers for the non-investable history of MSCI country indices. I again highlighted the momentum specifications for more clarity. The average monthly long-short returns are even larger and reach up to 0.77% per month. Again, those results are strongly significant and robust across two different portfolio construction approaches.
In two more tables that I left out at this point, the authors also report alphas of their strategies versus the Fama-French (1992) three factor model.5This model controls for the overall stock market, value, and size. It would be very interesting to also add the momentum factor to examine whether country and industry momentum generates alpha beyond momentum at the single-stock level. The results are very similar, and if anything, even more supportive for profitable returns of country or industry momentum.
Bottom line: Although the authors only report monthly average returns, which are not enough performance statistics to get a comprehensive view of the strategy, the evidence suggests that country and industry momentum seemed to work historically. Those are of course good news. Both for greedy investors (like you and me) who want to profit from momentum without too much trading, but also intellectually as it strengthens the evidence that momentum is an actually robust phenomenon.
The strategies seem to be implementable via ETFs
So much to the theory and hypothetical considerations. After explaining in great detail what ETFs are and how they differ from mutual funds – I skip this section here as everyone interested in asset management should know this in 2023 – the authors next examine if we can actually implement country and industry momentum via investable ETFs. The following table again summarizes average monthly returns and alphas for two different variants of country and industry momentum. I again highlighted the (in my view) most common specifications.
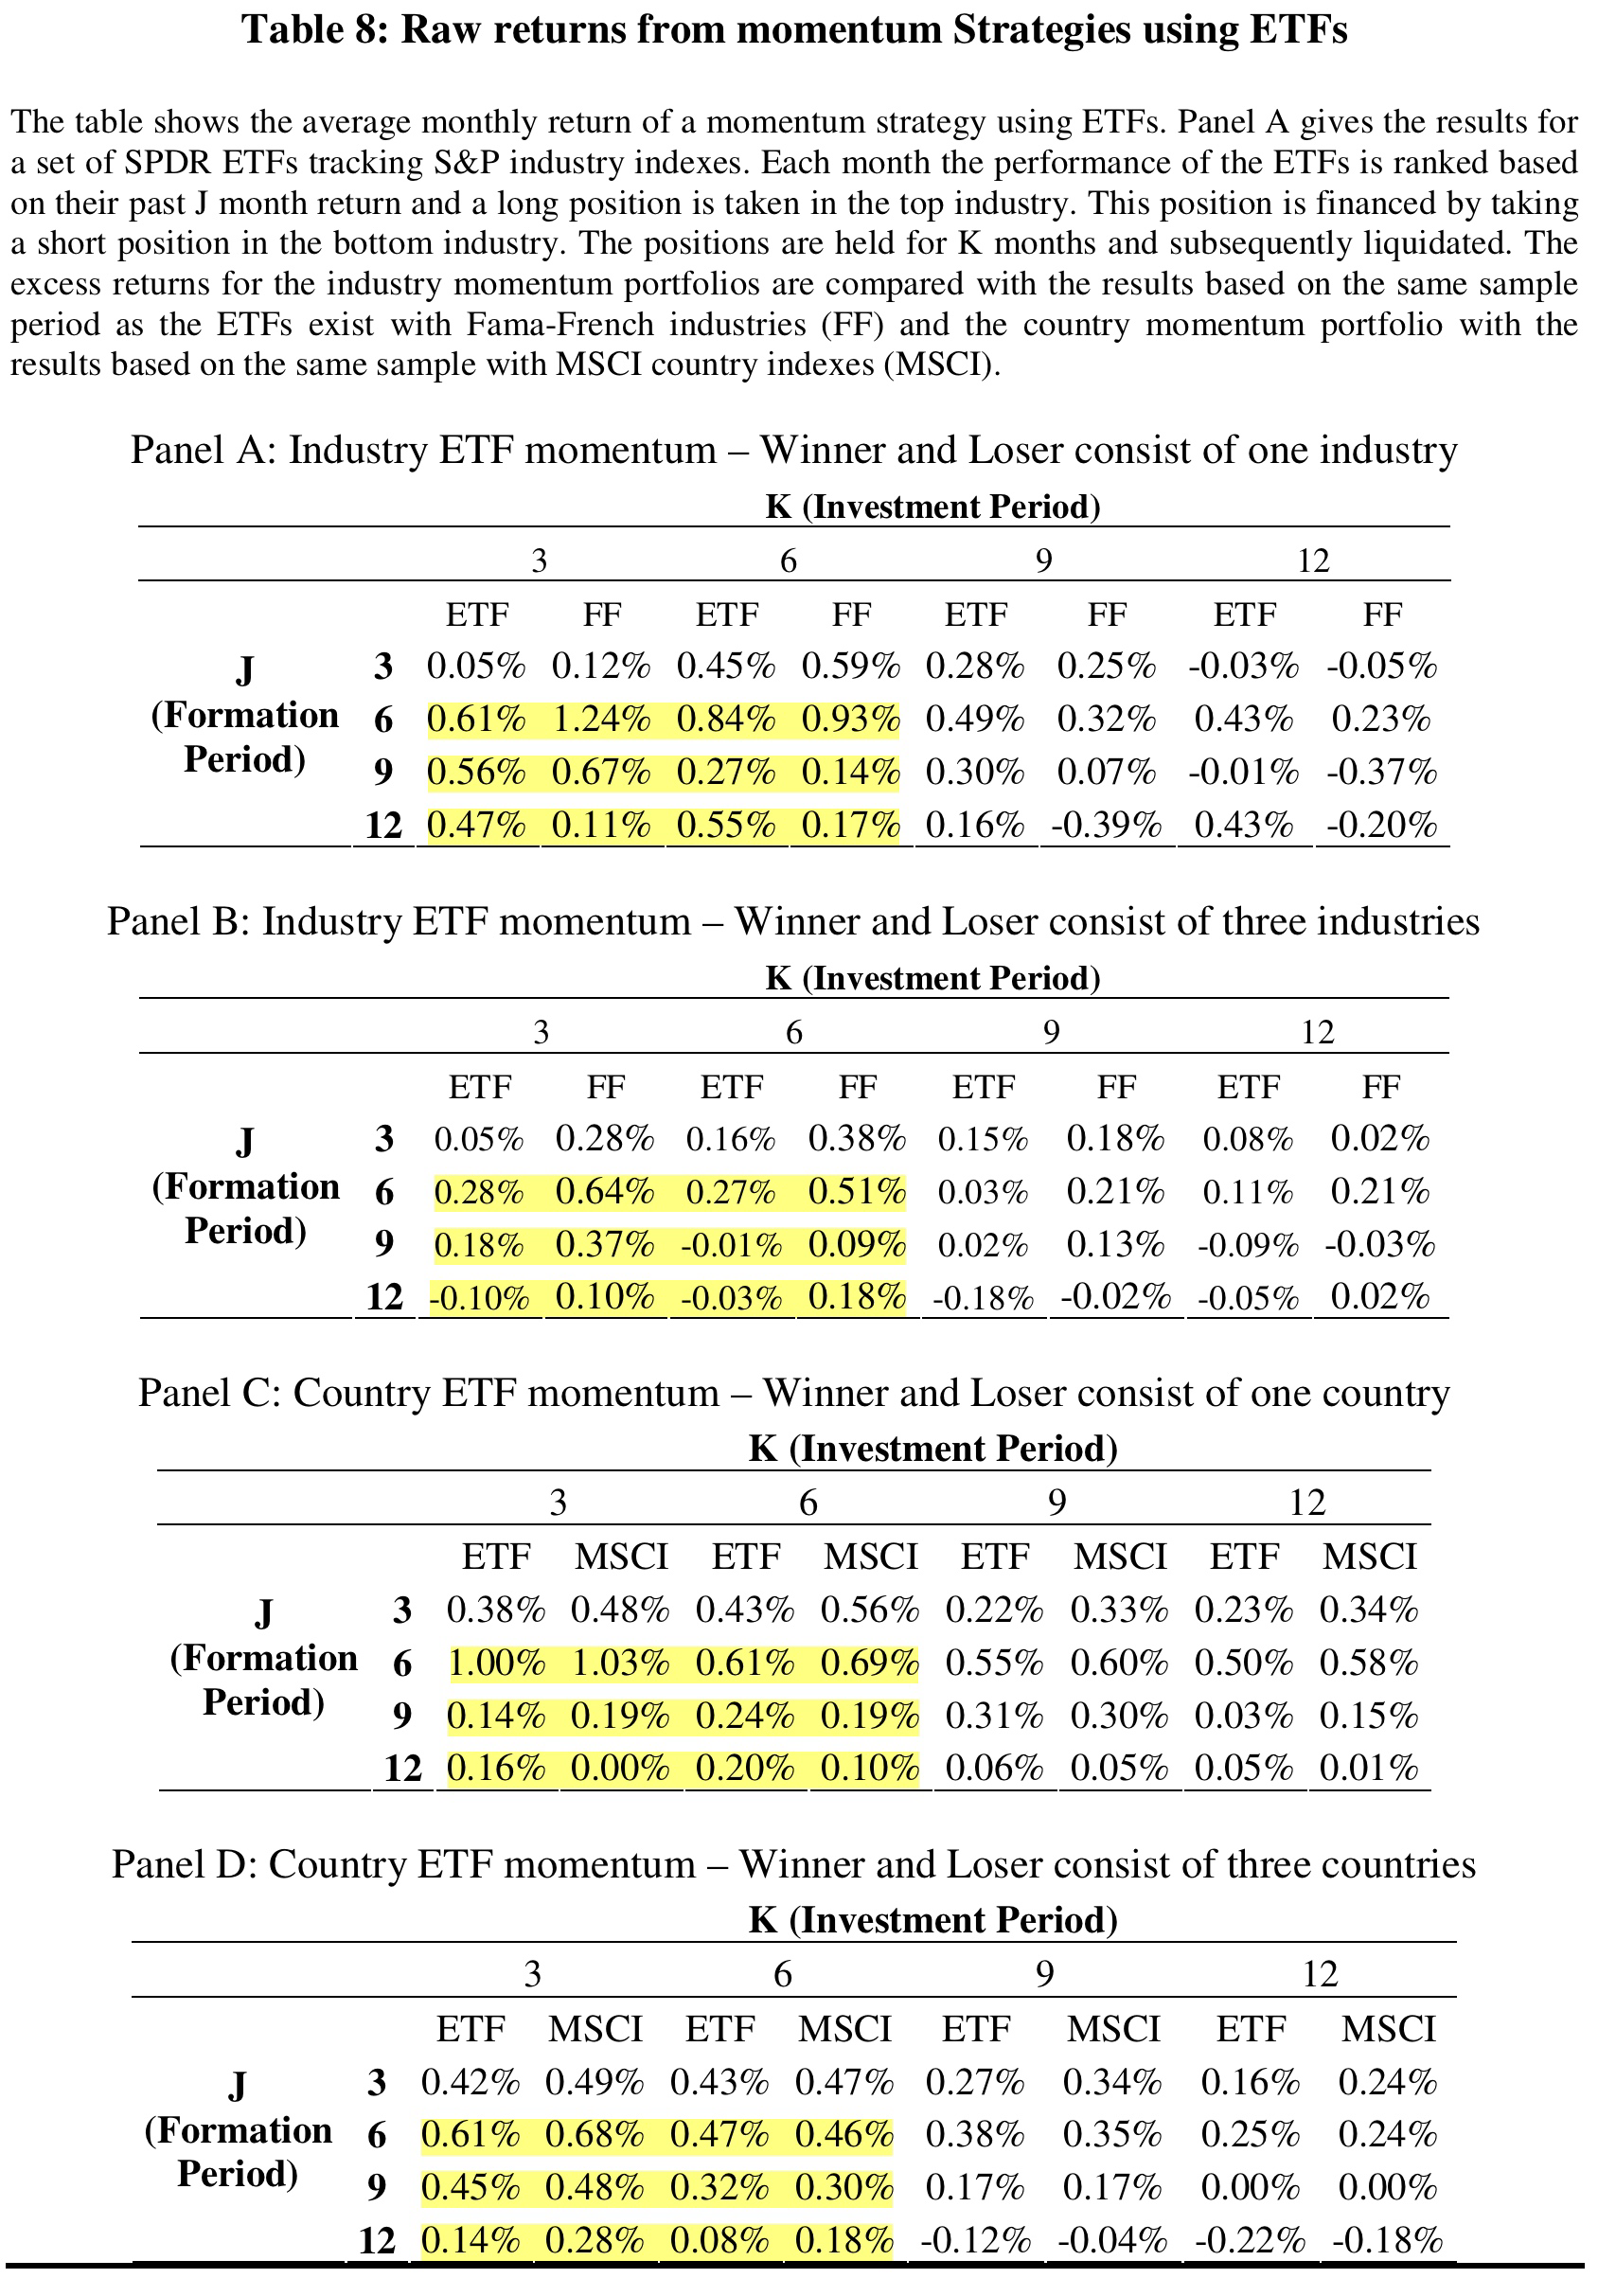
The results are generally promising. Average monthly returns of the ETF strategies go in the same direction as those of the equity indices and are again handsome. For industry momentum (Panel A), they range from 0.27% to 0.67% per month. For country momentum (Panel C), they even reach 1% per month although at more variability across the different formation and investment periods. Overall, however, the results seem to be more sensitive to changes in the portfolio construction methodology (Panels B & D). This is obviously not a good sign for robustness, but unfortunately not uncommon once we look at strategies through a more practical lens.
By and large, the authors nonetheless conclude that country and industry momentum can be implemented via ETFs and appears to be a viable trading strategy. They also present the following two charts with the cumulative performance of each strategy. This is of course very interesting from a practical perspective.
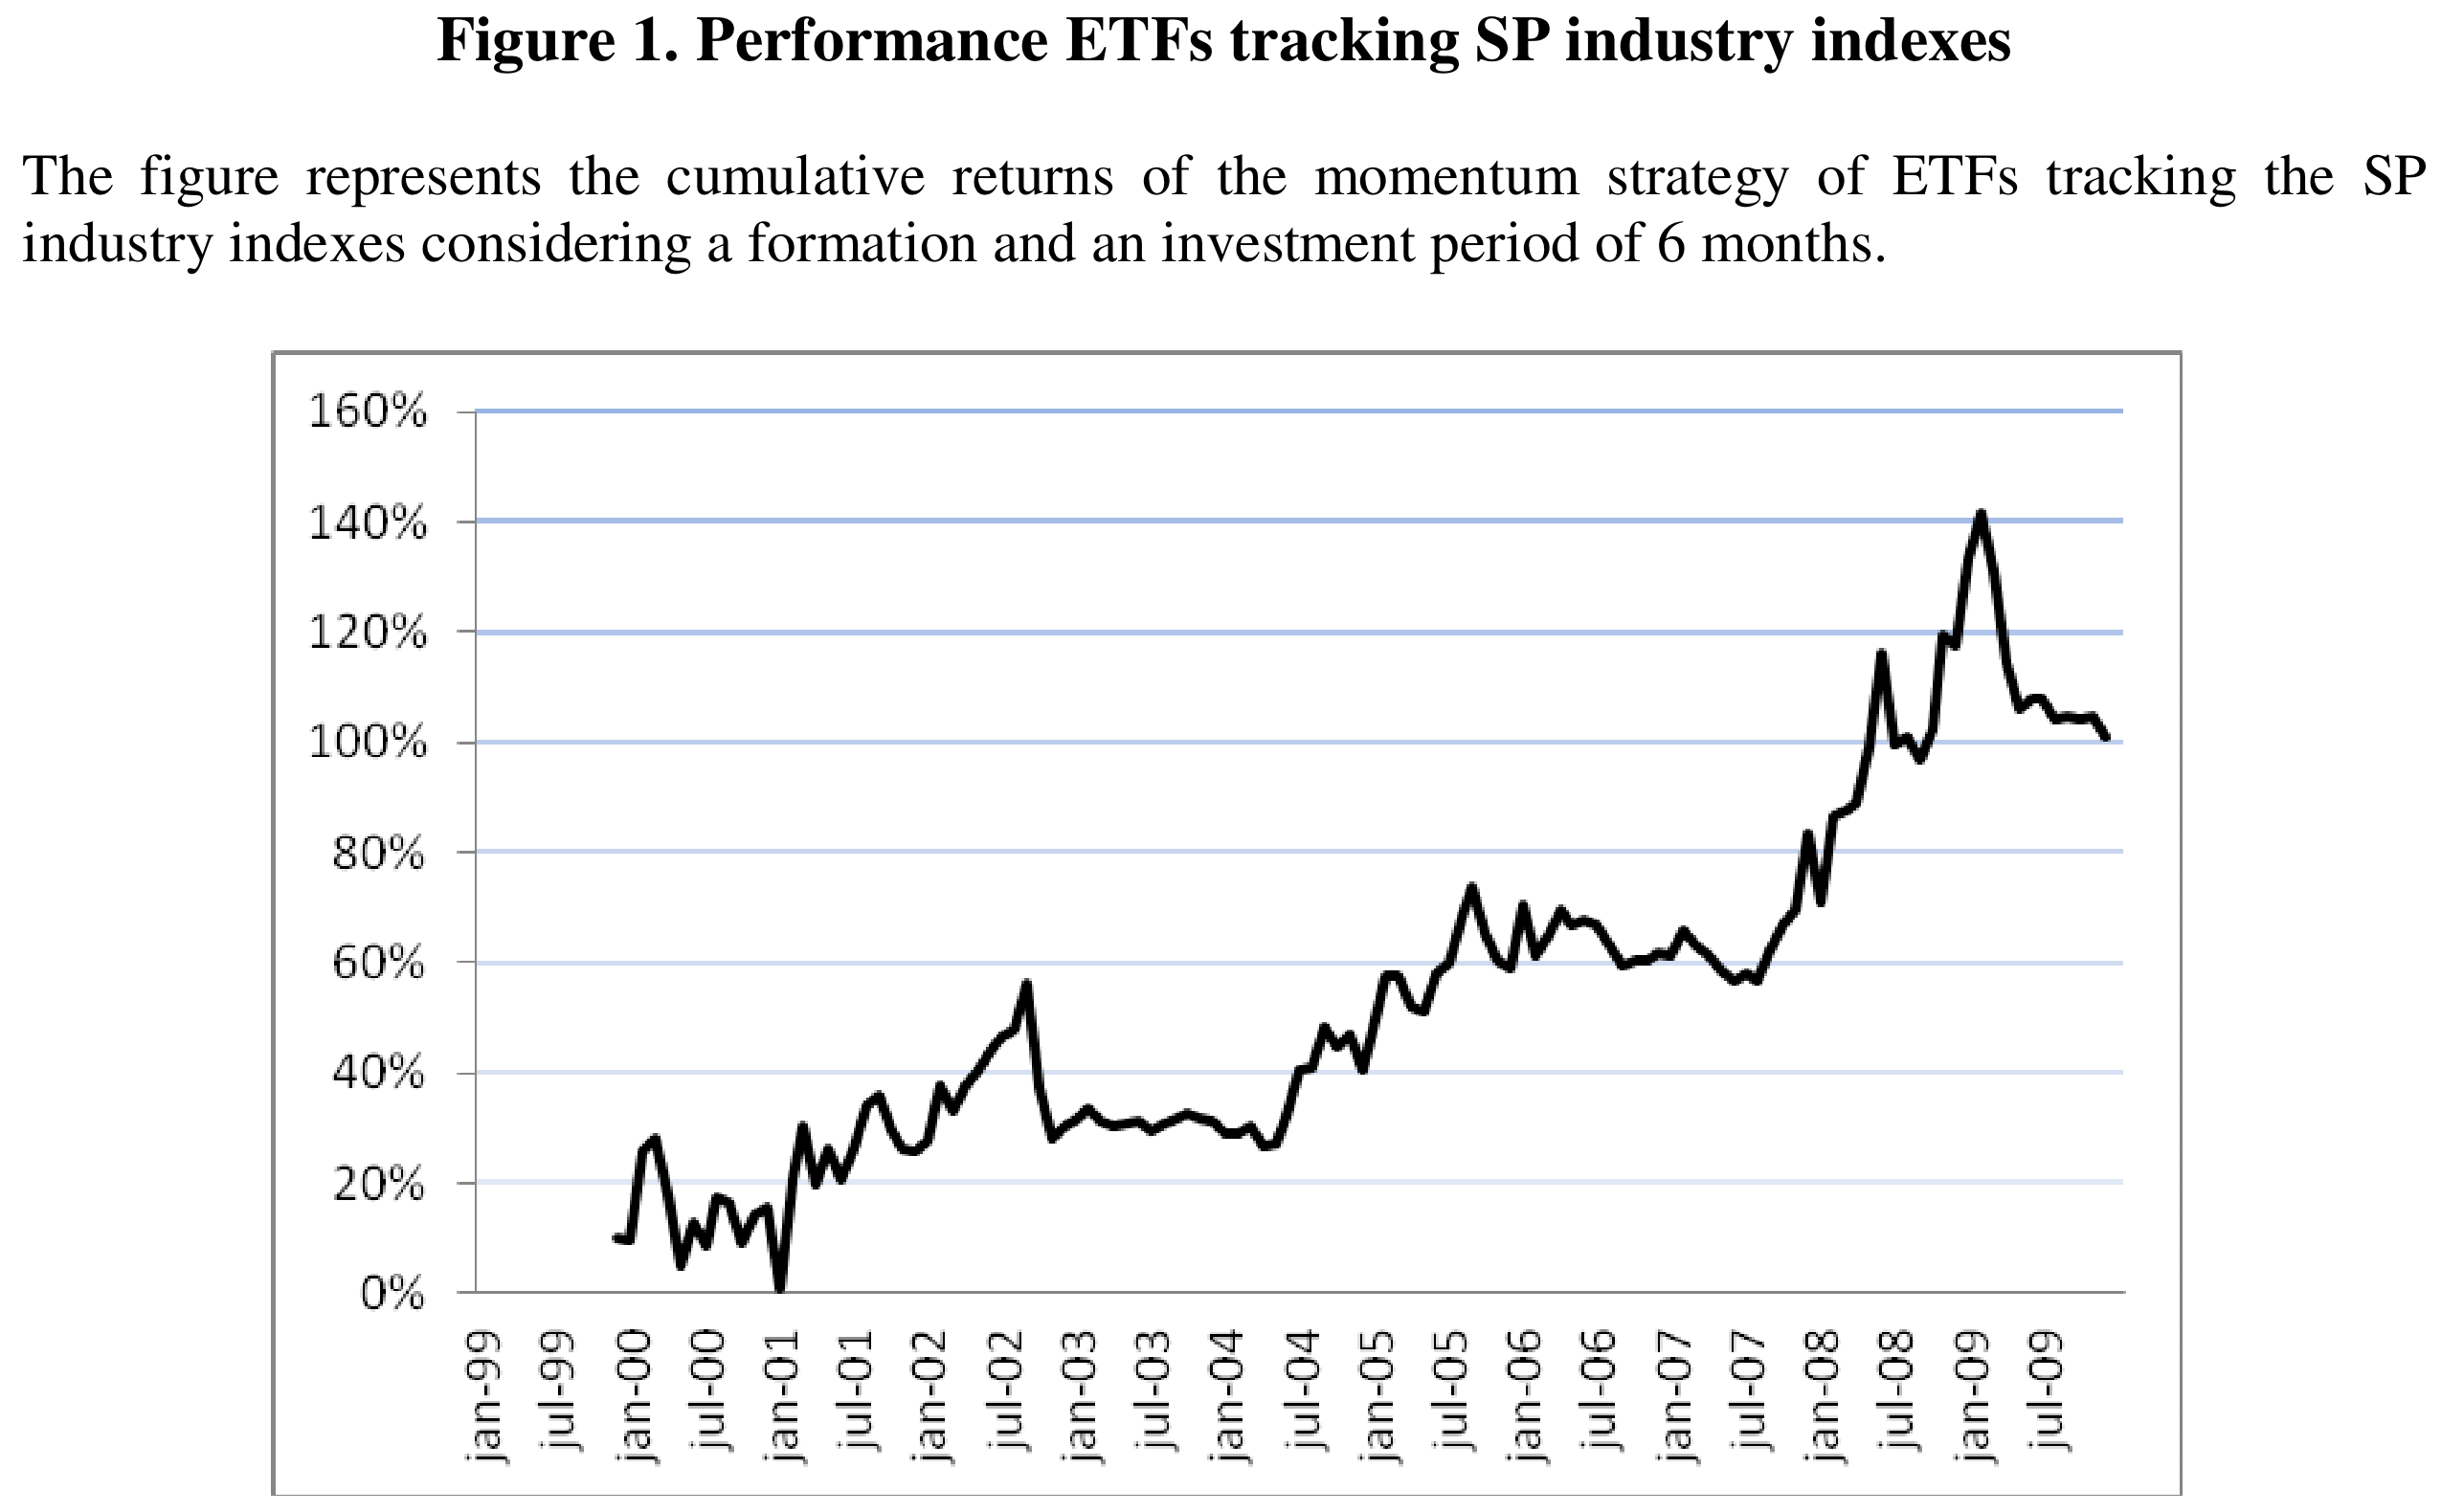
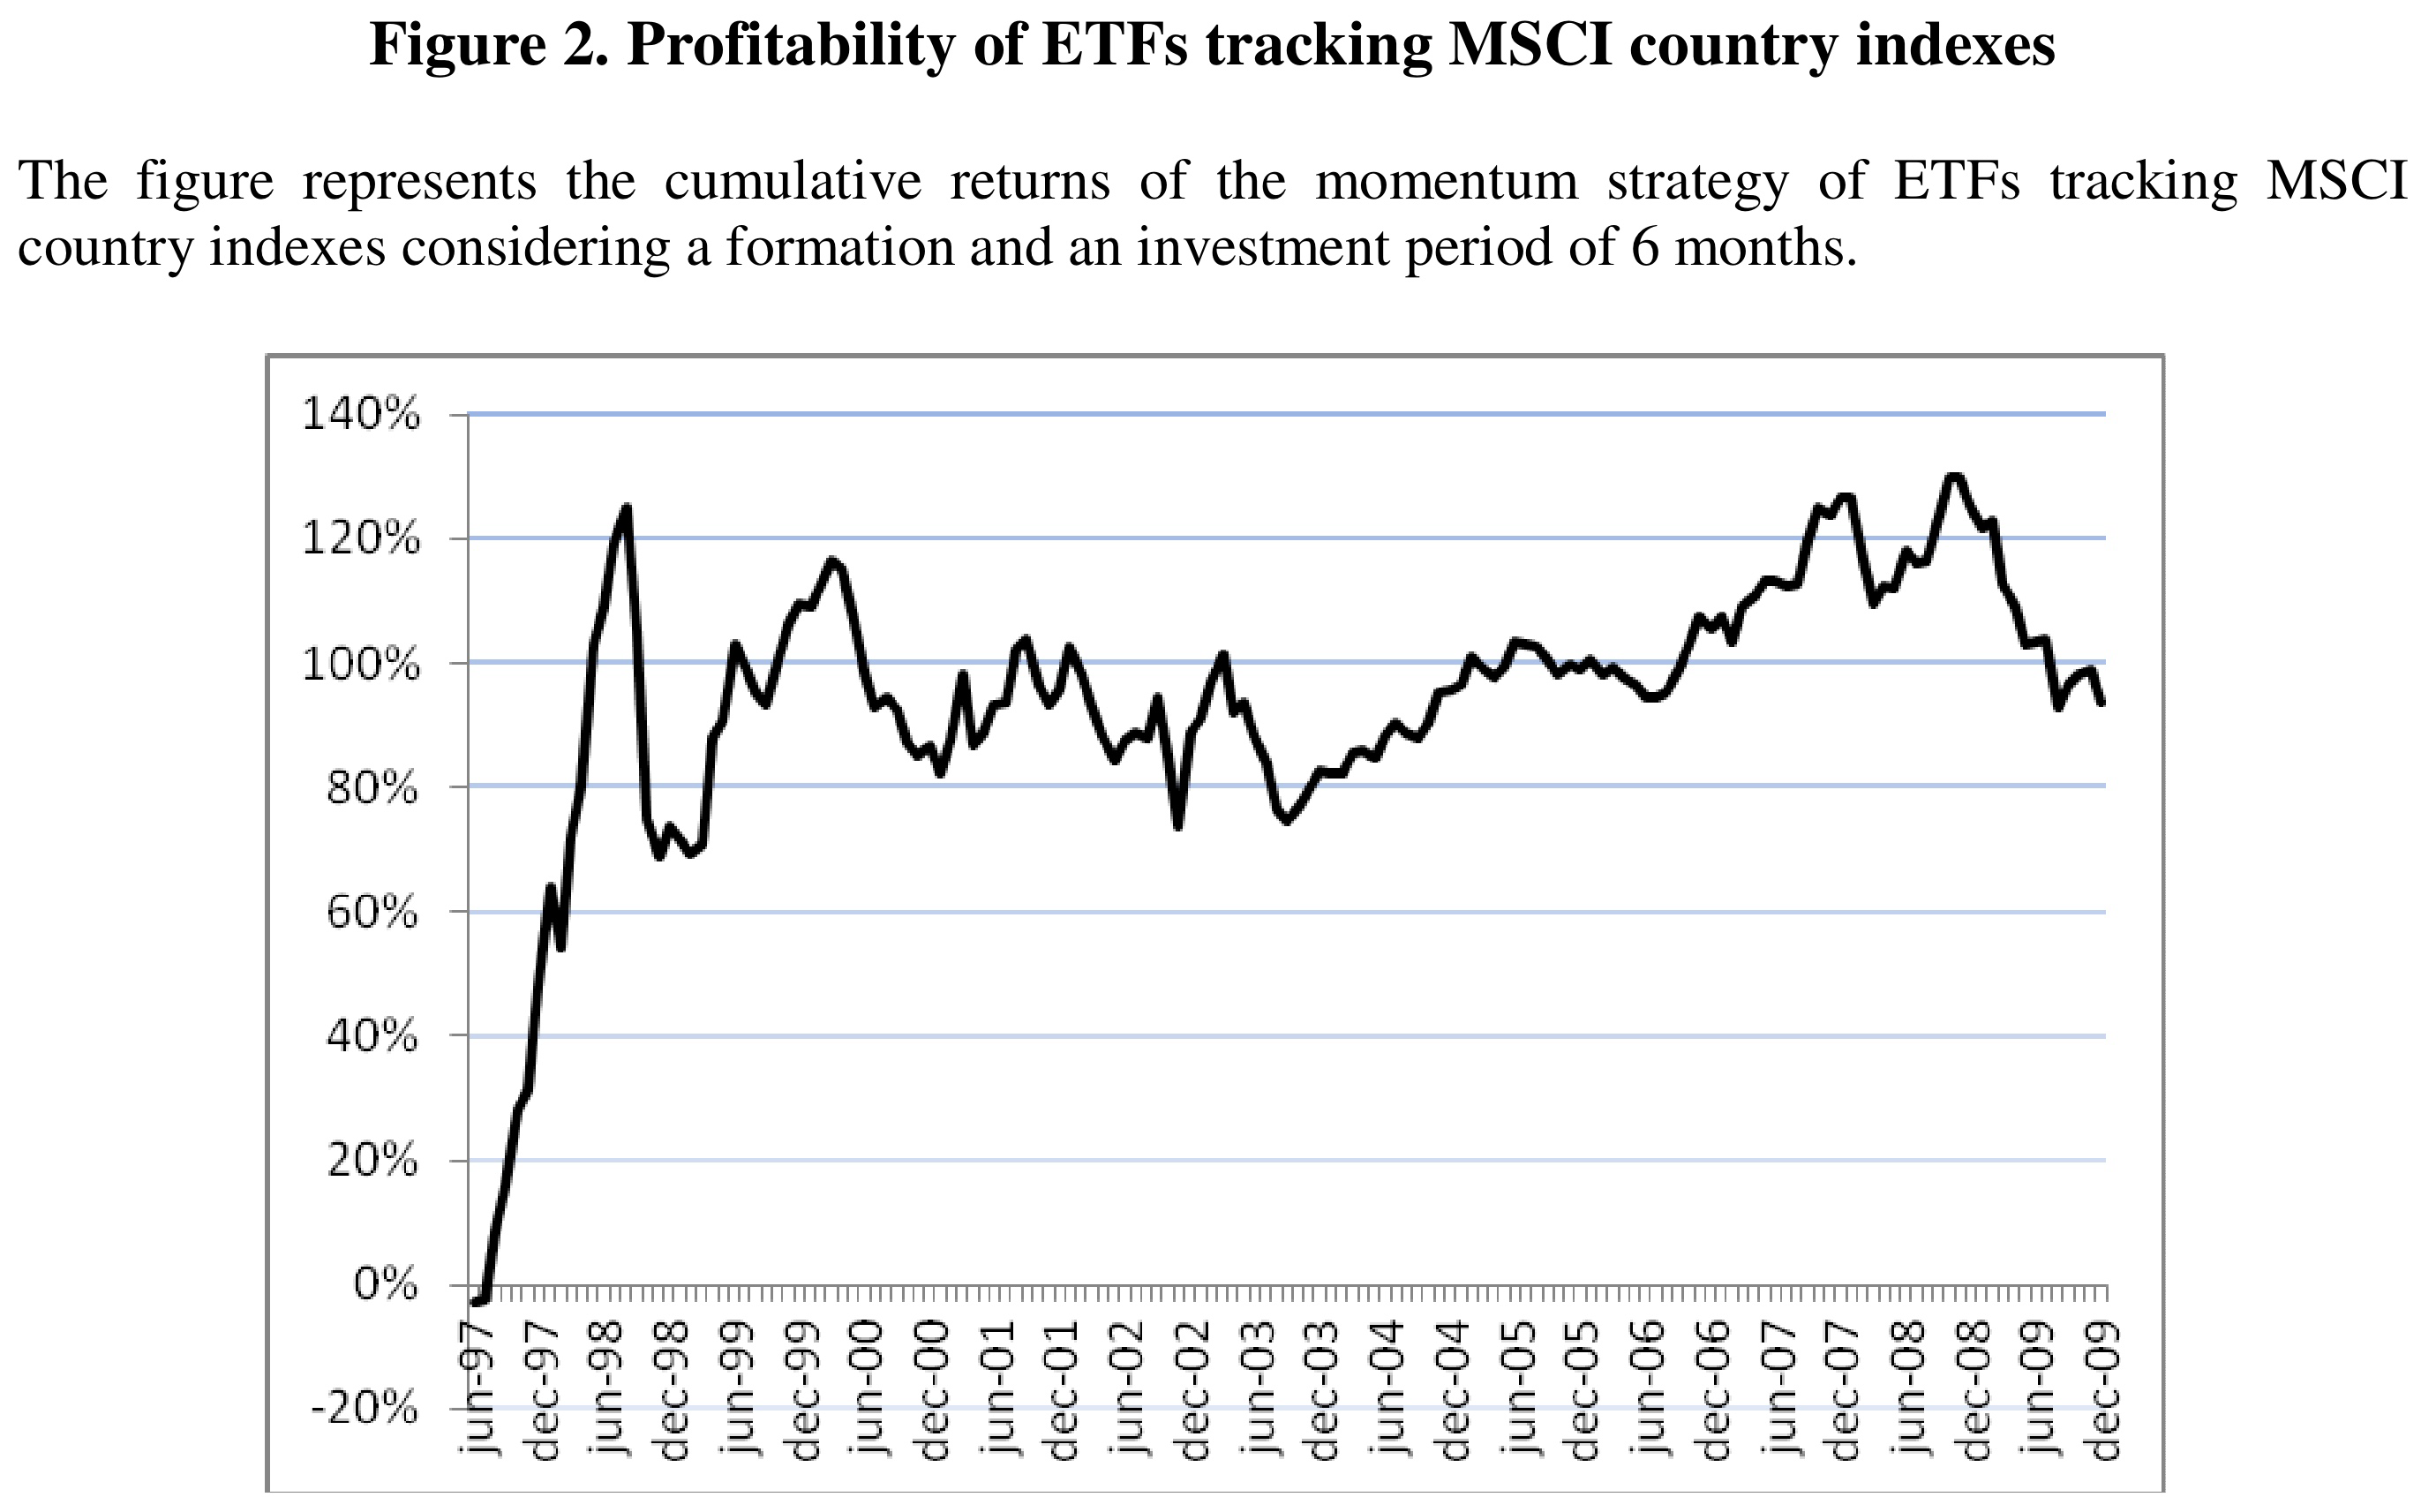
The chart for industry momentum looks obviously much better than that for country momentum, even though the returns are in the same ballpark. It is of course an alarming signal if most of our identified pattern comes from only a small part of the sample. The goal is to spot and trade on repeatable patterns that make money going forward. Looking at the chart, the strong performance of the country momentum strategy during the late 1990s unfortunately doesn’t tick this box for me personally.
The authors nonetheless conclude that investors can generally use ETFs to implement country and industry momentum as the results are quite similar to the hypothetical backtests with the underlying indices. Note that this is again not really surprising, as ETF providers attempt to replicate the underlying indices as close as possible and should deliver on their promise in a functioning market.
The strategies remained profitable after trading costs
Moving from non-investable equity indices to ETFs is the first important step towards reality, the next and similarly important one are trading costs. Based on their estimates, the authors argue that the break-even transaction costs for the country and industry momentum strategy are 1.10% and 0.65% per trade, respectively. If trading were cheaper, investors would have outperformed after costs, if it was more expensive, they would have underperformed.
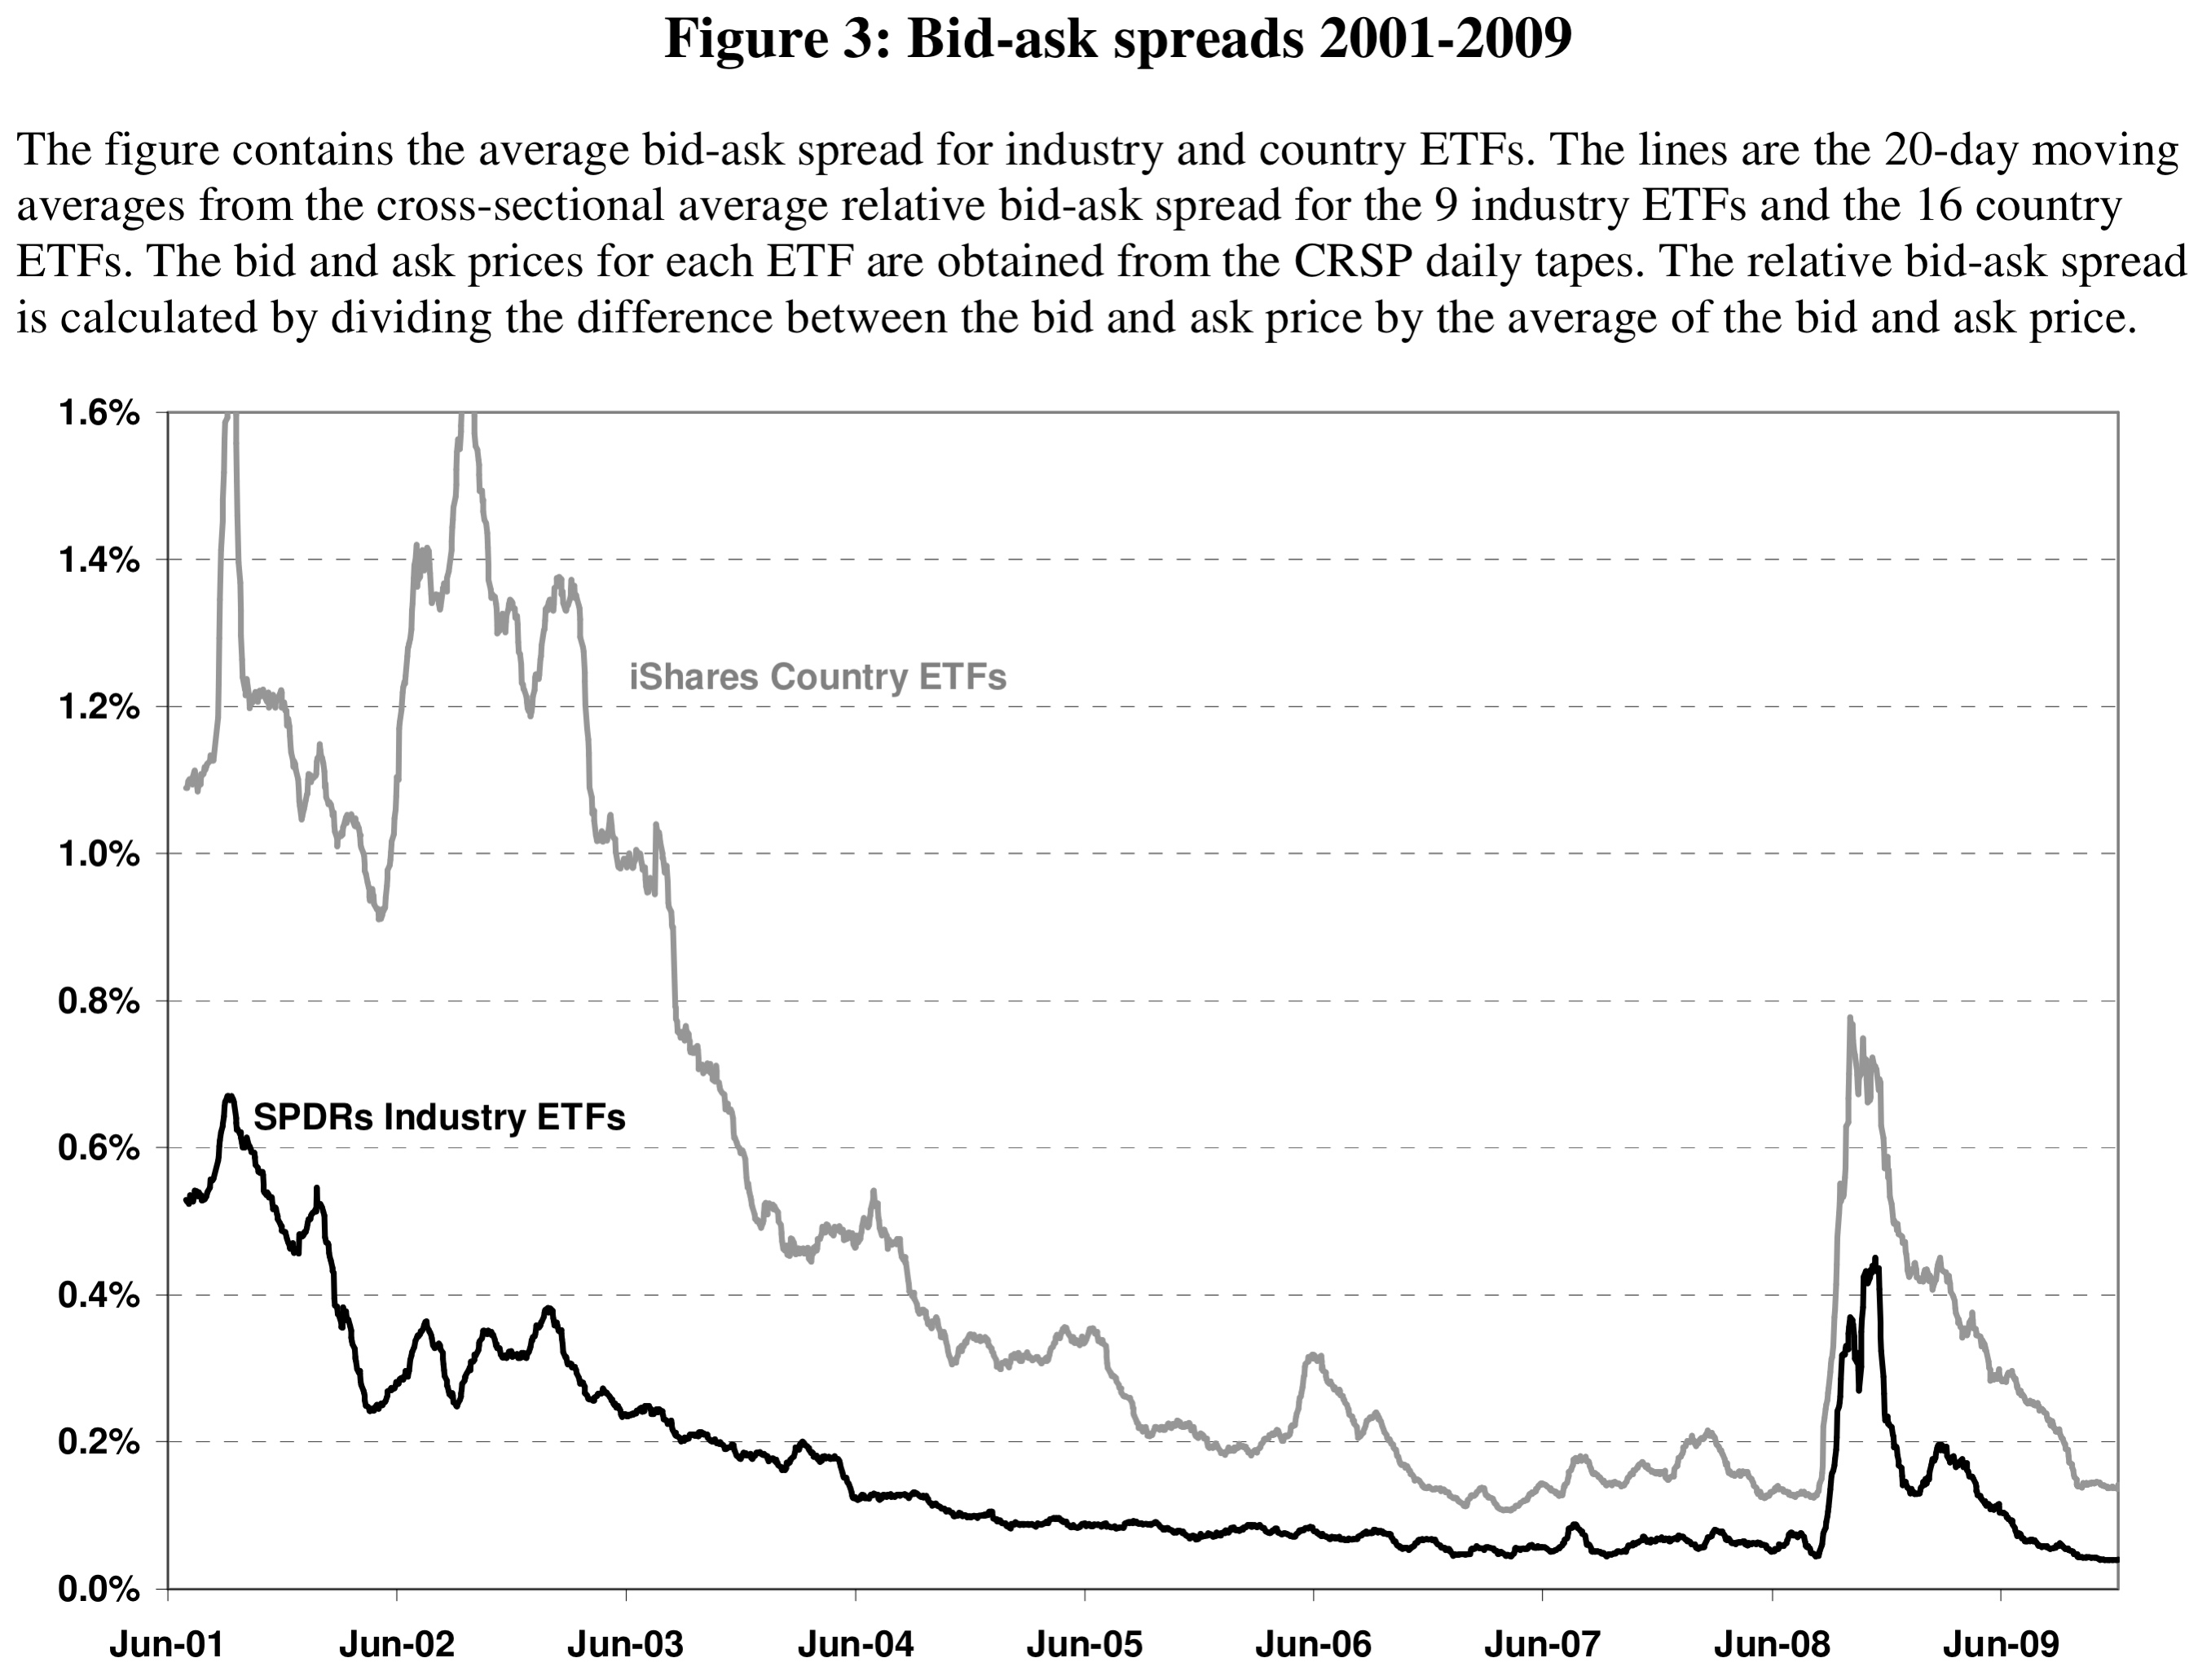
The chart above shows average bid-ask spreads (a large part of trading costs) for the country and industry ETFs. There are a couple of interesting observations. First, spreads and thus trading costs declined massively from 2001 to 2009. This is part of a larger trend and coincides with the rise of high-frequency trading. Second, US industries are much cheaper to trade than international country indices. Given the sophistication of the US financial markets and the S&P 500 universe in particular, this is not really surprising. Finally, and this is the most important takeaway for country and industry momentum, the average bid-ask spreads are below the break-even transaction costs most of the time. There are occasional spikes from trading frictions during difficult times, but by and large, the authors argue that the momentum strategies should survive trading costs.
Conclusions and Further Ideas
To be honest, I don’t yet buy the results. The tables with the average monthly returns are a good starting point, but the charts of the cumulative returns suggest that the strategies might not be too attractive in practice. On the other hand, the paper is definitely interesting for factor-believers like me without the opportunity to implement momentum with large portfolios of stocks. So my conclusion is mixed and I believe the paper is a great starting point for further analyses.6Over the years, other authors and practitioners also documented momentum patterns among equity indices. For example, Asness et al. (2013).
On a more general level, the paper also highlights the beauty of momentum. You only need a price or return time series to construct the momentum factor, so you can apply it to basically everything that has publicly available prices. It is therefore tempting and somewhat logical to exploit momentum profits among easy-to-trade assets like ETFs. But such advantages (sorry for being the pessimistic economist) of course come at the cost of higher competition. If something profitable is easy to do, chances are high that more people will do it. So even if further analyses reveal significant country and industry momentum, I believe such strategies should be less profitable than the more-difficult-to-implement momentum among single stocks. Having said that, a little implementable momentum is probably better than no momentum at all…
- AgPa #83: How Much of the US Market is Passive?
- AgPa #82: Equity Risk Premiums and Interest Rates (2/2)
- AgPa #81: Equity Risk Premiums and Interest Rates (1/2)
- AgPa #80: Forget Factors and Keep it Simple?
This content is for educational and informational purposes only and no substitute for professional or financial advice. The use of any information on this website is solely on your own risk and I do not take responsibility or liability for any damages that may occur. The views expressed on this website are solely my own and do not necessarily reflect the views of any organisation I am associated with. Income- or benefit-generating links are marked with a star (*). All content that is not my intellectual property is marked as such. If you own the intellectual property displayed on this website and do not agree with my use of it, please send me an e-mail and I will remedy the situation immediately. Please also read the Disclaimer.
Endnotes
| 1 | The beauty of momentum is that it only requires price data to test it. Therefore, you can apply it to virtually anything that has a price. |
|---|---|
| 2 | Nowadays, there are also ETFs that track momentum indices. That is of course a step in the right direction, but usually those indices come with several methodological issues. |
| 3 | A funny side note: The authors explain in great detail what ETFs are and how they differ from mutual funds. Today, 10 years later, this is unthinkable and illustrates how asset management has changed over the last decade. |
| 4 | According to the authors, this methodology comes from the original momentum paper by Jegadeesh and Titman (1993). |
| 5 | This model controls for the overall stock market, value, and size. It would be very interesting to also add the momentum factor to examine whether country and industry momentum generates alpha beyond momentum at the single-stock level. |
| 6 | Over the years, other authors and practitioners also documented momentum patterns among equity indices. For example, Asness et al. (2013). |