
Why Do Equally Weighted Portfolios Beat Value-Weighted Ones? (2022)
Alexander Swade, Sandra Nolte, Mark Shackleton, Harald Lohre
The Journal of Portfolio Management 49 (5), URL/SSRN
This week’s AGNOSTIC Paper examines one of the most common ideas of portfolio construction. Equal weighting. At least on paper, equal weighted strategies often outperform market cap weights and sometimes even more sophisticated optimizations. In a very simple, yet somehow brilliant analysis, this week’s authors examine where this historical outperformance comes from…
Everything that follows is only my summary of the original paper. So unless indicated otherwise, all tables and charts belong to the authors of the paper and I am just quoting them. The authors deserve full credit for creating this material, so please always cite the original source.
Setup and Idea
Two of the most common weighting rules for quantitative equity strategies are equal and value weights (stocks in proportion to their market capitalization). Naturally, equal weighted strategies tend to be more active as passive benchmarks follow value weights by construction. The virtues of equal weights are simplicity, ease of use, no concentration issues, and historically better performance for many strategies. The main drawback is higher turnover as maintaning equal weights requires continuous rebalancing. Market cap weights, in contrast, are self-rebalancing and don’t require turnover beyond portfolio additions and deletions. The main problem of value weights are concentration issues. Think about a value weighted portfolio of Apple and various small caps. The portfolio will essentially consist of Apple.1You say this is an unrealistic example? Take a look at the swiss equity market which consists to about 47% of Nestle, Roche, and Novartis.
By construction, equal weights tend to overweight smaller stocks with respect to a passive benchmark. Since many anomalies tend to be more pronounced among small caps, equal weighted backtests often generate better-looking results than value weights and therefore resonate with researchers.2I am no exception from this. The same pattern holds in my master thesis. Whether those results also hold up in practice after costs is a different story, but it is nonetheless interesting to see where this effect comes from. Using a (in my opinion) very cool methodology, the authors explain the outperformance of equal over value weighted strategies by some of the major factors.
Data and Methodology
The authors examine the spread between equal and value weighted strategies (EW and VW) at the example of the US equity market between 1963 and 2021. For this purpose, they use monthly data from CRSP and Compustat, two standard high-quality databases. To account for practical implementation, they examine both the entire US market (CRSP) and S&P 500 stocks separately.
With respect to the factor analyses, the authors follow the academic and practitioner literature and use various factors from established sources. They use the Size, Value, Momentum, Profitability, Investment, and Short-Term Reversal factors from Kenneth French’s database. The Low-Volatility factor from Van Vliet and De Koning (2017). The Quality-Minus-Junk factor from Asness et al. (2019). And finally, they also use the factors of the q-factor model from Hou et al. (2015) to stress-test their results. I believe this is a pretty comprehensive set of factors and captures most of the empirically robust anomalies.
Beyond that, the authors essentially just use simple multivariate regressions. As I mentioned several times in this blog, I really like it when researchers derive interesting and robust results while adhering to the principle of parsimony.3For the normal readers who don’t feel the need to use complicated scientific words. Parsimony is the idea that the simplest way to sufficiently explain the data should be preferred. The authors simply take the returns of an “EW minus VW” long-short portfolio (EW-VW) and regress those on the return time series of the factors.
Important Results and Takeaways
EW portfolios outperformed VW ones in the US market
Given the title of the paper this is not going to be a major surprise, but the authors nonetheless start with a simple performance comparison of equal and value weighted portfolios in the CRSP and S&P 500 universes (EW vs. VW and SPW vs. SPX, respectively). The following chart shows the cumulative performance over time.

The equal weighted portfolios clearly outperformed their value weighted counterparts over the sample period from 1963 to 2021 (note the log scale). The authors also mention that equal weighted portfolios outperformed in 33 of 59 years in the CRSP sample, and in 37 of 59 years in the S&p 500 universe. However, such a long cumulative chart hides a lot of volatility beneath the surface. The following table therefore provides more details about the risk and return of the portfolios and the EW-VW spread.

I highlighted a few numbers which I find particularly interesting. Over the sample period, EW portfolios outperformed VW portfolios by about 3.5%-points per year which translates into a monthly return of 0.29% for the long-short EW-VW spread. Interestingly, however, this outperformance is not particularly robust. For example, a lot of the EW outperformance seems to be related to the January Effect (65.4% vs. 17.3% in January, 10.3% vs. 10.9% in Non-January). Furthermore, the pattern strongly reverses for the subsample period after the first publication of the size effect in the literature (Post-Publication). Such decays are unfortunately not surprising. Financial markets are adaptive systems and when someone publishes a profitable strategy, it will probably no longer be as profitable in the future.
Over the long-term, however, EW portfolios did outperform before costs. While this outperformance came with higher volatilities and drawdowns, the excess return more than compensated the higher risk. Risk-adjusted Sharpe ratios (SR) are slightly higher for EW than for VW portfolios. The results for the more practical S&P 500 universe are generally similar, but less pronounced (Panel B). Again, I think this is not too surprising as any form of return predictability should be weaker in a more efficient segment of the market.
EW bets on Size, Value, and against Momentum, Quality, and Low-Risk
In the next sections, the authors build up various regression models to explain the systematic drivers of the EW-VW spread in their sample. They comment extensively on each specification and argue for more comprehensive factor models. I refer readers who are interested in those discussions directly to the paper. In the following, I will only cover the final and most comprehensive analyses as these offer (in my opinion) all relevant insights. I highlighted the coefficients and t-statistics of the final regression models for each universe in the table below.
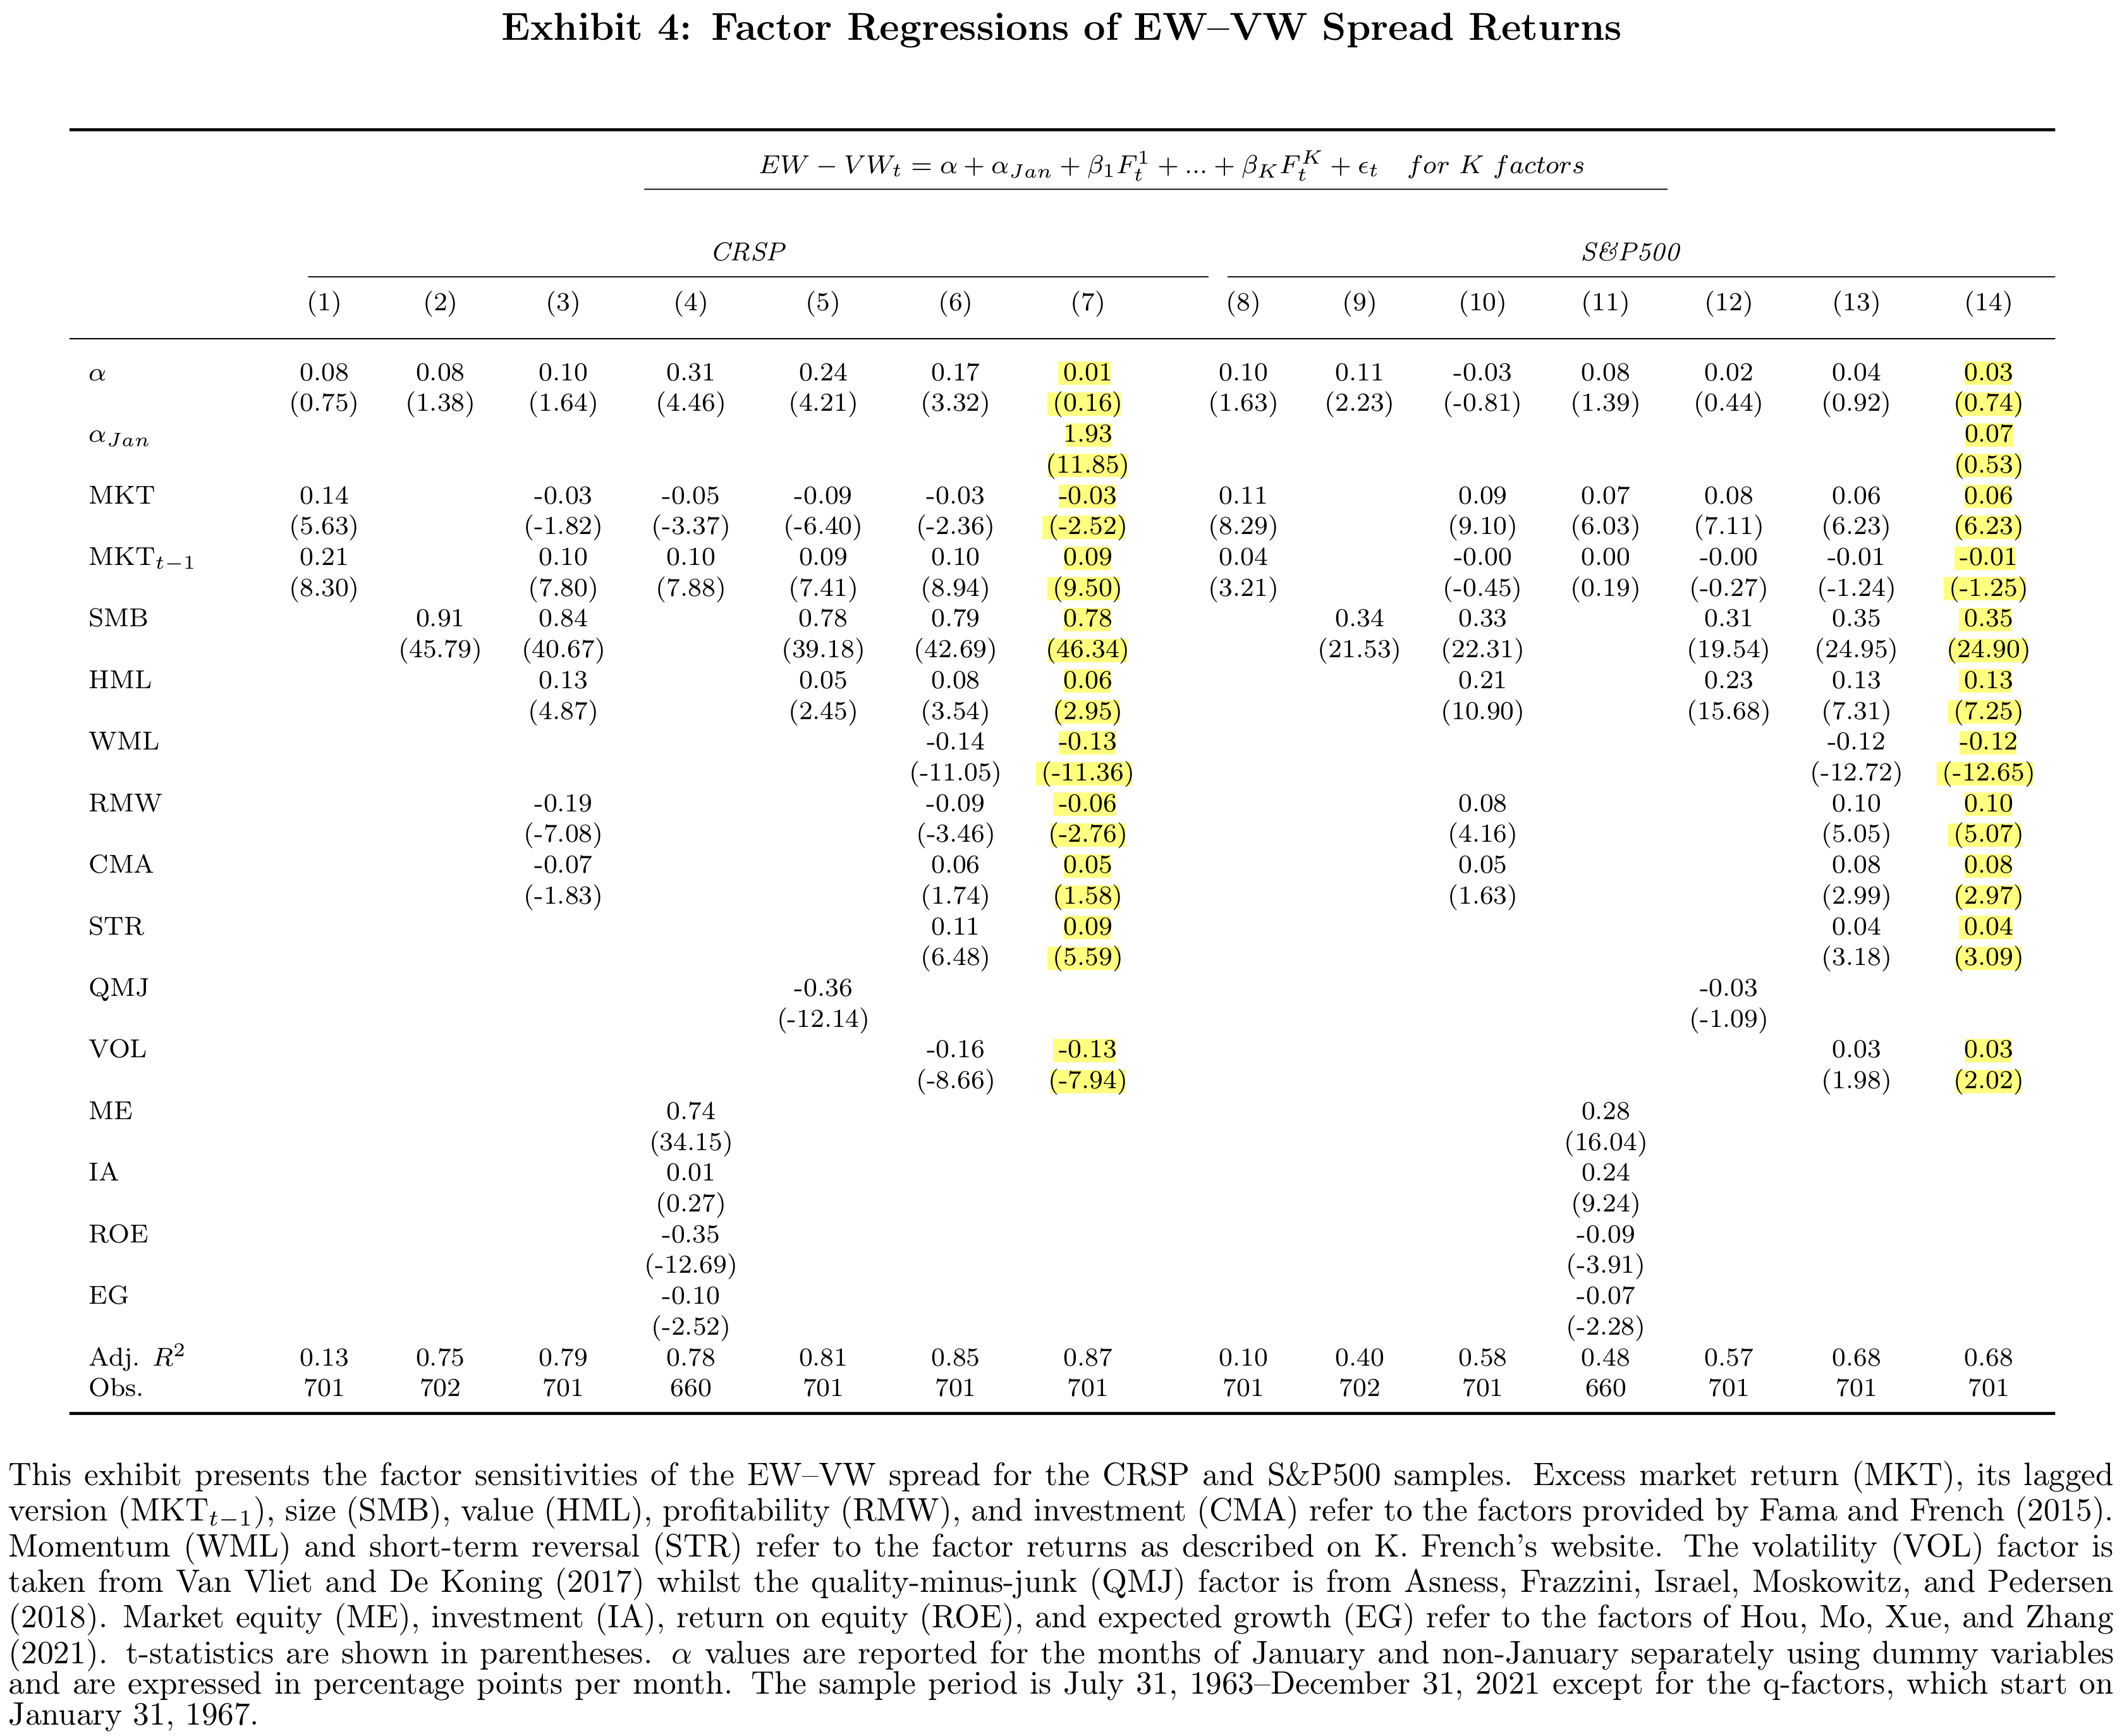
There are various interesting and actually quite intuitive results. First, controlling for all the factors reduces the non-January alpha of the EW-VW spread to zero. This is not surprising as simply equal-weighting stocks is not a particular sophisticated and secretive strategy. Second, the January Effect remains highly significant for the CRSP universe. This is consistent with research that finds strong outperformance for small caps in January. Intuitively, there is no such effect for the S&P 500 universe. Third, the EW-VW portfolios do have significant exposure to the overall market. Again, I think this is not too surprising. Without further optimization, it is very unlikely that a long-short combination of different portfolios ends up beta-neutral.4The authors also include the lagged market return to control for thinly traded small or micro caps in the CRSP universe.
Now to the other factors. In danger of stating the obvious, the EW-VW spread loads heavily on the Size factor (SMB) and those coefficients are gigantically significant (t-statistics of up to 46). There are also significantly positive relations with Value (HML) and Short-Term Reversal (STR). On the negative side, Momentum (WML) and Low-Risk/Defensive factors stand out. The negative factor loading on Momentum is again not very surprising. By its virtue, equal weighting is a contrarian strategy. You trim winners and double-down on losers to maintain equal weights. This is exactly the opposite of Momentum which attempts to let winners run and sell losers quickly. Using this argument in reverse therefore also explains the positive loadings on contrarian-type factors like Value and Short-Term Reversal. The other negative loadings on Quality (RMW) and Low-Volatility (VOL) are consistent with existing empirical evidence from Asness et al. (2019) that small stocks tend to be more volatile and of lower fundamental quality.
Most of the results are generally similar in the S&P 500 universe, although of less statistical significance. As I mentioned before, this is fully in-line with (my) expectations as there should be less predictability in a more efficient segment of the market. However, there are two notable differences to the CRSP universe. Within the S&P 500, the EW-VW spread loads positive instead of negative on the Quality (RMW) and Low-Volatility (VOL) factors. I suspect that this comes from the fact that the S&P 500 already consists of higher quality and less volatile stocks than the rest of the US market.
The EW-VW spread is an imperfect, but cheap and simple proxy for the size effect
In the final part of the paper, the authors examine an interesting practical idea. If the EW-VW spread is so strongly related to Size, it could be an interesting tool to capture the Size Effect without the hustle of trading a large portfolio of illiquid small caps. To implement EW-VW, we just need to buy an equal-weighted ETF and short the market against it. Both positions are relatively easy to implement, even for individual investors. The authors analyze this idea in more detail and compare the performance of market-wide Size (SMB) and “within S&P 500” Size (SMPSP) to various alternatives.
EW-VW and SPW-SPX refer to the spreads between equal and value weighted portfolios in each universe. R2000 ETF-SPX is a practical proxy for the size effect consisting of a long position in the Russell 2000 and a short position in the S&P 500. Small cap-SPX and Micro cap-SPX follow the same logic, but use market-wide small and micro cap funds from Dimensional Fund Advisors instead of the Russell 2000. The table below summarizes the results.
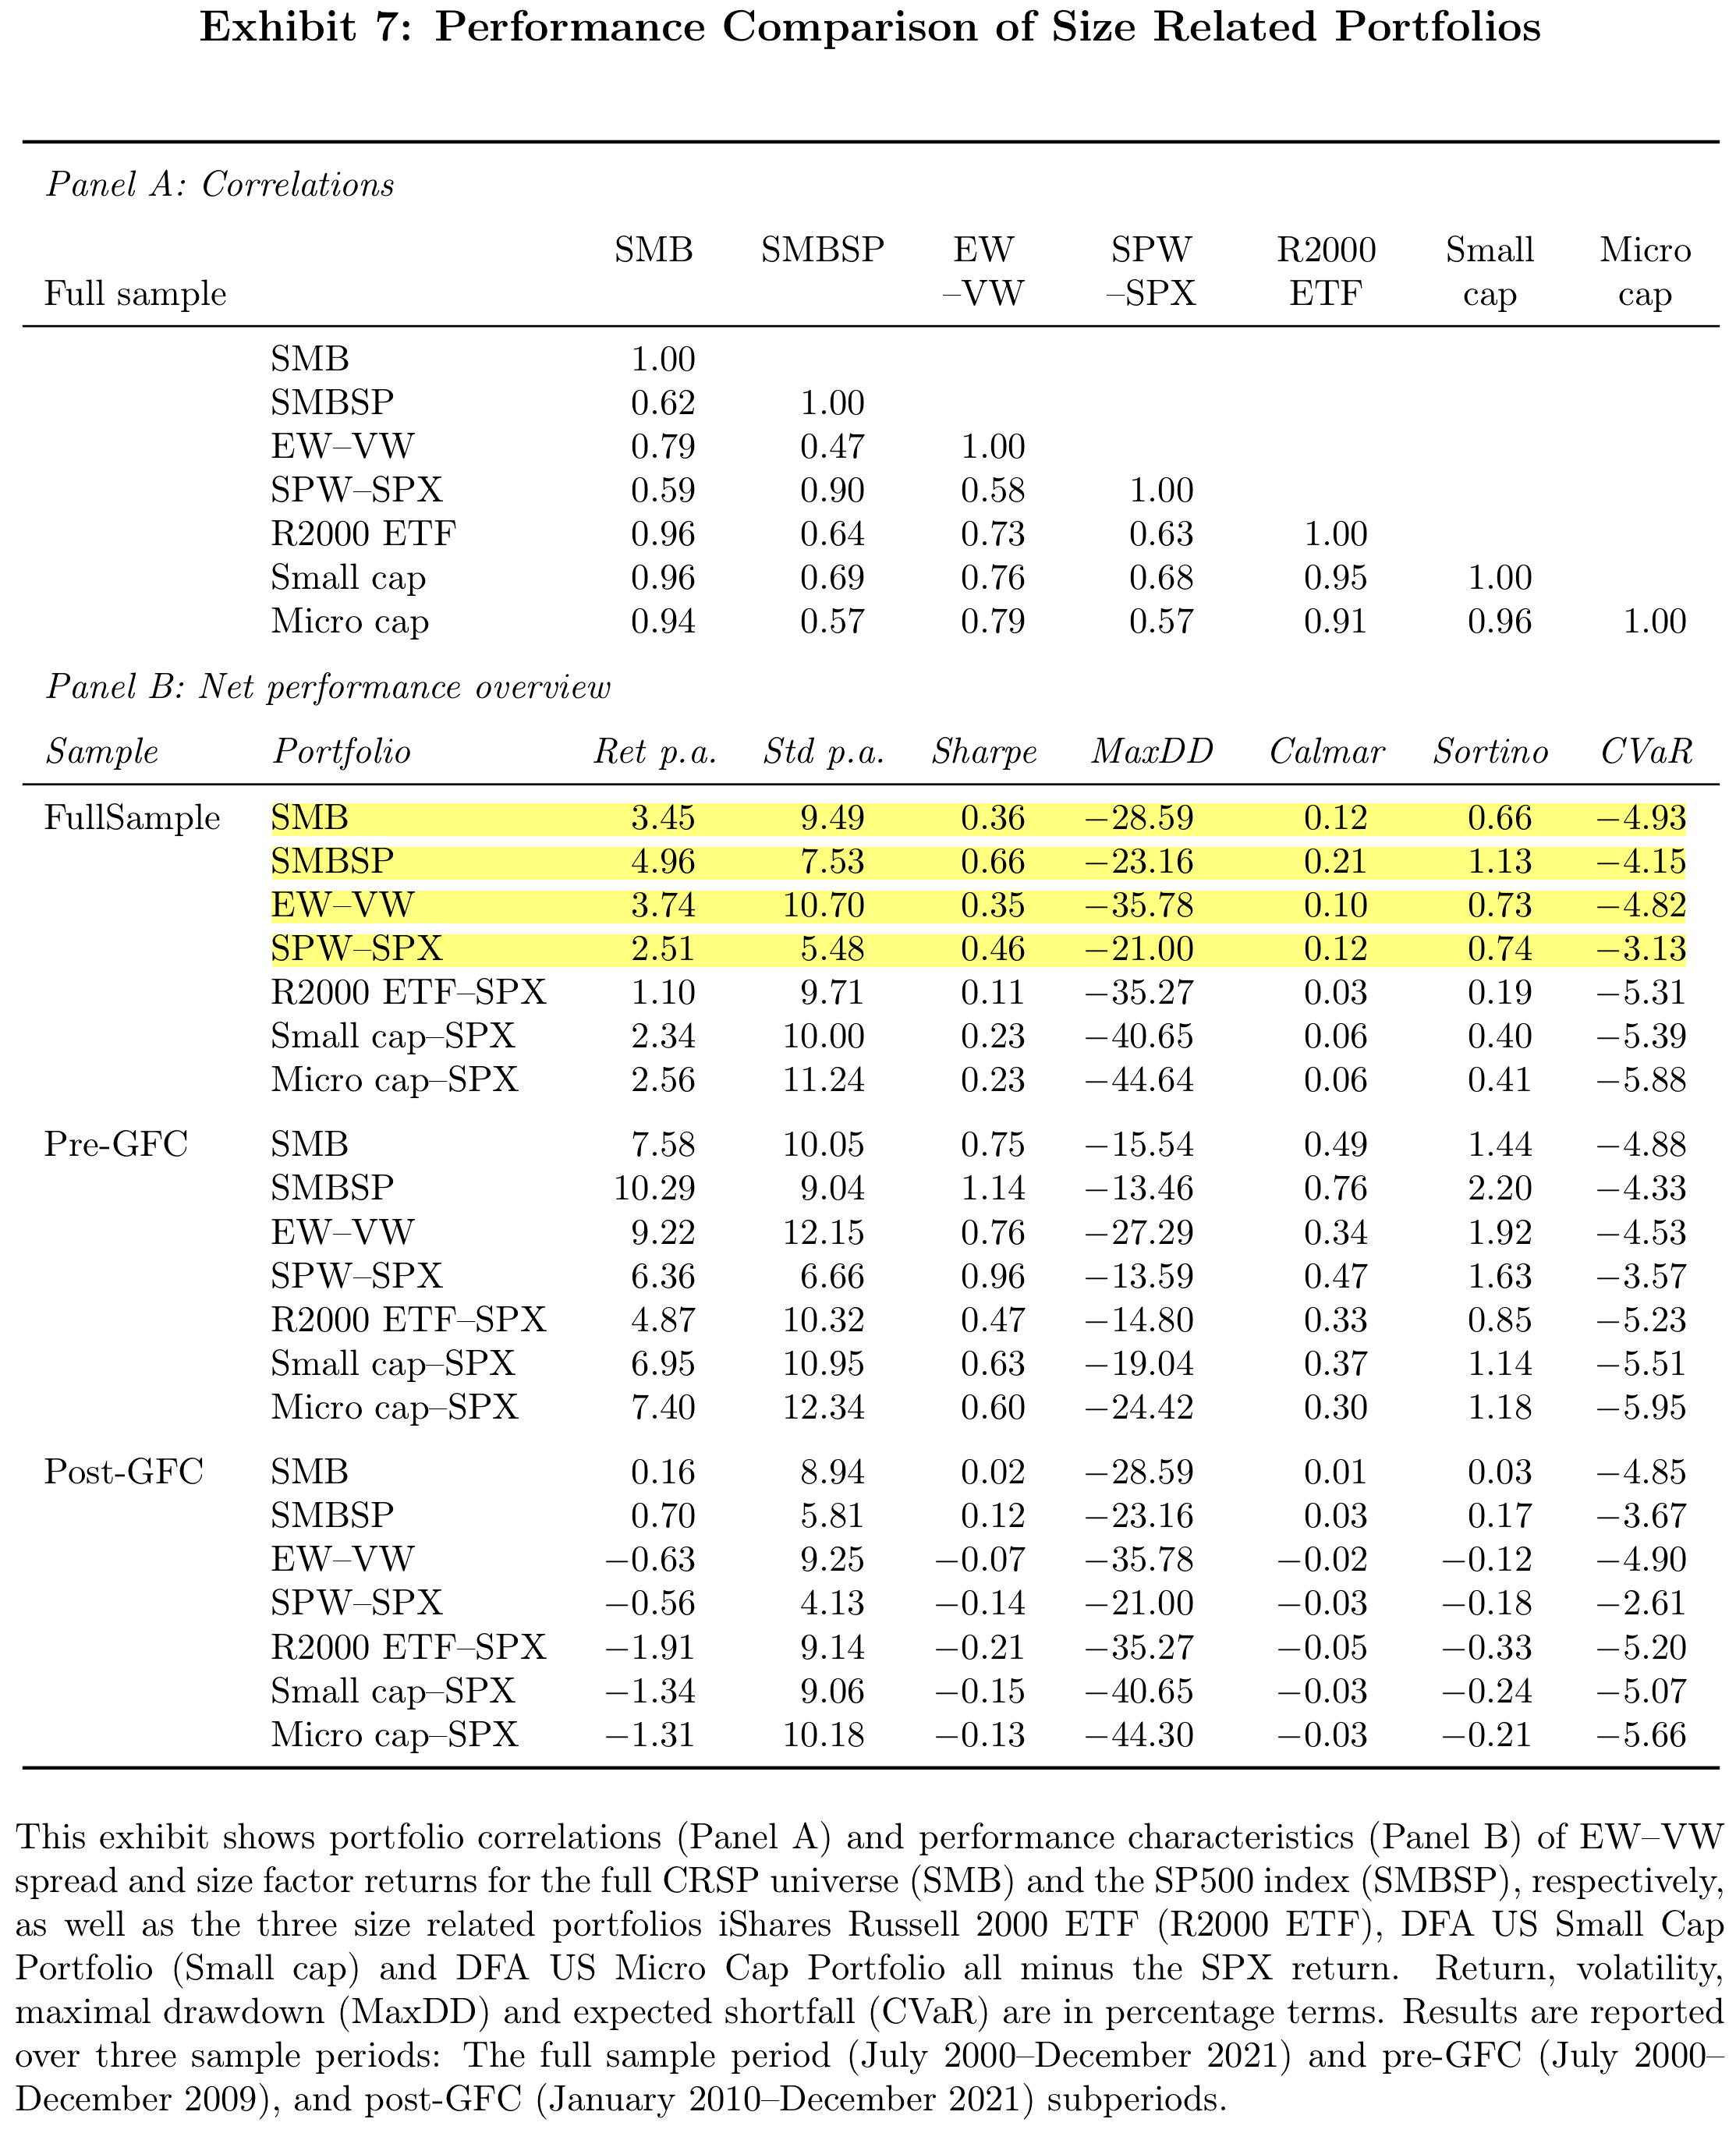
Starting with Panel A, the correlations between the “traditional” size strategies and the EW-VW alternatives are indeed quite high. For example, the correlation coefficients for the EW-VW portfolio, SMB, and R2000 ETF-SPX are between 0.73 and 0.79. This is pretty substantial. Panel B further shows that the EW-VW alternatives generated comparable or even better risk-return profiles than SMB or the “traditional” size strategies.
But high correlation of course doesn’t mean that the strategies are exactly the same. The relation is not perfect and this can have quite some consequences for investors. For example, the split between the Pre-GFC and Post-GFC sample period reveals that the EW-VW portfolios couldn’t capture the theoretical size premium in the years after the GFC. In fact, they actually lost money while the Size effect (SMB and SMBSP) was slightly positive. To be fair, this also applies to the other practical implementations of the Size premium in that period. And the comparison of real-world ETF strategies to hypothetical before-fees long-short portfolios is not appropriate anyway. The authors therefore argue that although imperfect, EW-VW still seems to be a viable alternative to capture the Size premium. I think this is reasonable as the implementation benefits most likely outweigh the imperfect correlation in practice.
Conclusions and Further Ideas
To be honest, I mainly picked the paper because I think the methodology is a really cool idea. It was one of this moments when you realize, “Damn, this is such a simple straight-forward way to examine this issue. Why haven’t I thought about that?”. Most importantly, I believe we can use the same methodology to analyze many other interesting questions. For example, which factors fueled the US outperformance over the last decade? Or can we explain the recent underperformance of China by factor exposures or is it really an idiosyncratic tail-risk? The idea of using factor models to analyze realized performance is of course not new. Until reading this paper, I just didn’t thought hard enough to get the idea that we can also use them to analyze questions like those mentioned above.
Another, in my opinion, very important takeaway is the impact of unintended bets in seemingly simple weighting approaches. The portfolio weights should be logically consistent with the character of the desired strategy. For example, Value is a contrarian strategy (buy stuff that is cheap because no one likes it) while Momentum is the complete opposite (buy stuff that performed well because everyone likes it). Equal weighting comes with a natural contrarian tilt, so it apparently doesn’t make too much sense for Momentum.5Again, most equal weighted Momentum backtests still look better than value weighted. This most likely comes from the fact Momentum, like many factors, tend to work better among small caps which equal weights naturally overweight. Following these arguments, however, a value weighted Momentum strategy in a small cap universe seems logically more consistent than a market-wide equal weighted one. Why should you trim winners in a strategy that attempts to let winners run? On the other hand, doubling-down on cheap stocks that are still cheap seems logically consistent with the contrarian-idea of value. I believe those are important insights for portfolio construction.
Finally, there are a few aspects where I believe the takeaways from the paper are limited. First, most of the analyses are pure theoretical exercises. For the most part, the authors simply ignore the practical implementation of the EW-VW portfolios and the factors. Second, the paper puts huge emphasis on the Size effect whose stand-alone existence is an ongoing subject of discussion among practitioners and academics.6See for example the views of AQR, Robeco, Research Affiliates, and Alpha Architect. Finally, and this is the standard one, the paper only examines the US market. Of course, it would be very interesting to see if the same factors also drive the EW-VW spread in other regions. Given the intuitive reasons behind many of the results, I personally expect that.7It as least very unlikely that international EW-VW portfolios are not related to the SMB factor of the respective region… Since the data requirements to do such an analysis out-of-sample are not too high, I guess we will see a follow-up pretty soon.
- AgPa #83: How Much of the US Market is Passive?
- AgPa #82: Equity Risk Premiums and Interest Rates (2/2)
- AgPa #81: Equity Risk Premiums and Interest Rates (1/2)
- AgPa #80: Forget Factors and Keep it Simple?
This content is for educational and informational purposes only and no substitute for professional or financial advice. The use of any information on this website is solely on your own risk and I do not take responsibility or liability for any damages that may occur. The views expressed on this website are solely my own and do not necessarily reflect the views of any organisation I am associated with. Income- or benefit-generating links are marked with a star (*). All content that is not my intellectual property is marked as such. If you own the intellectual property displayed on this website and do not agree with my use of it, please send me an e-mail and I will remedy the situation immediately. Please also read the Disclaimer.
Endnotes
| 1 | You say this is an unrealistic example? Take a look at the swiss equity market which consists to about 47% of Nestle, Roche, and Novartis. |
|---|---|
| 2 | I am no exception from this. The same pattern holds in my master thesis. |
| 3 | For the normal readers who don’t feel the need to use complicated scientific words. Parsimony is the idea that the simplest way to sufficiently explain the data should be preferred. |
| 4 | The authors also include the lagged market return to control for thinly traded small or micro caps in the CRSP universe. |
| 5 | Again, most equal weighted Momentum backtests still look better than value weighted. This most likely comes from the fact Momentum, like many factors, tend to work better among small caps which equal weights naturally overweight. Following these arguments, however, a value weighted Momentum strategy in a small cap universe seems logically more consistent than a market-wide equal weighted one. |
| 6 | See for example the views of AQR, Robeco, Research Affiliates, and Alpha Architect. |
| 7 | It as least very unlikely that international EW-VW portfolios are not related to the SMB factor of the respective region… |